Documentation
1. Introduction
We love software. They really make our life easier ... if they work.
If the worst happens (i.e. the our beloved application doesn't work) then the user has to call / send a mail to the administrators and ... wait.
It was the side of the user (who wants to use the application). The other side is the maintenance that will get the call / mail eventually
and has to resolve the problem.
Usually there are well-known processes how to solve the issue (e.g.ImportDataException: Not enough space on drive occurs then
first delete the old import files and restart the import, etc.).
So what the database / middleware / Unix / ...
administrator has to do is to find the right process that will remedy
the problem and execute it step by step. I am not saying that's all what
they only do but sometimes these boring, not very interesting tasks have to be done.
It is interesting to examine what the business applications do with the errors / exceptions : basically nothing. They write errors in their log files and that is all. There are 3rd party tools that can monitor the log files and send a mail / text message but nothing more.
There are some tasks here that can be done automatically:
- monitor the application log files (managed centrally)
- if an incident occurs then select a process (a flow of commands) to be executed
- execute series of commands on one / more hosts
So what is Reaction about in short?
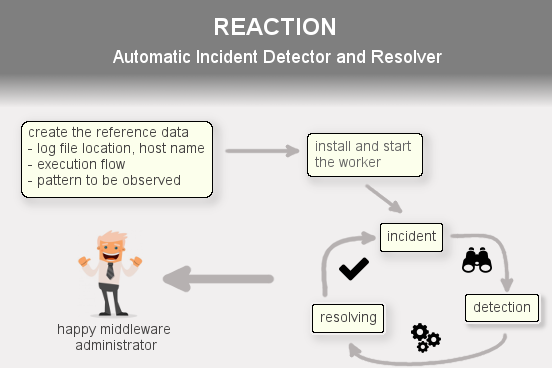
What needs to be done is to define what log files (host, log file location) have to be monitored, specify the flow of commands (operating system commands that are executed on the same or separate hosts) like an activity diagram and bind these together i.e. define the execution flow that has to be run if an error (e.g. ImportDataException) is detected in an application log file.
The good news is that it is exactly what Reaction was born for!
1.1. What is Reaction for?
Shortly the Reaction system can perceive incidents by monitoring the application log files; if a known regular expression pattern (e.g. .*java\.lang\.OutOfMemoryError.*) is detected then select the execution flow (which is basically a series of operating system commands) that can fix the problem and execute its tasks one by one on one/more hosts.
How can it do all of these?
First of all the log files have to be specified (i.e. define where they are: host, log file location) that need to be monitored.
Here you can create hierarchy like: we have the Hermes CRM clustered system that works on 4 server
machines with different files per hosts: creating a top level record (Hermes CRM) and 4 children (Hermes server0, ...).
Then the execution flow has to be created which can contain
- operating system (Unix or Windows) commands
- if-else conditions
- sending a mail commands
Finally these two (the execution flow and the systems which are basically the log file location) have to be glued together by creating a so-called error detector where you can set the pattern (that will be examined in the log files), select the system (log file) and the flow.
If this data is set then all you have to do is to start the worker (which is a Java application runs in the background) on the machines where the log files are or where the OS commands have to be executed.
Main components
Reaction has 3 components:
- workers
- reader
- executor
- engine
- administration web application
The administration web application is the tool where all the information can be specified. Also you can find detailed information about the progress of the started / scheduled flow, flow can be scheduled or started manually, etc.
The reaction engine is responsible for communicating with the workers, starting/approving/scheduling a flow, managing the flow execution with the workers, etc.
There are 2 kinds of workers:
- reader - it can read the log file(s) on a host machine and report the incidents
- executor - it can execute the OS commands and send back the result
These 2 can be started / stopped separately. It is important to note
that they will operate in the background, so all have to be done is to
start them. Only the configuration file has to be set up correctly.
All the information (i.e. the location of the log file, etc.) will be synchronised automatically.
1.2. How does it work?
First of all have a look at the picture below.
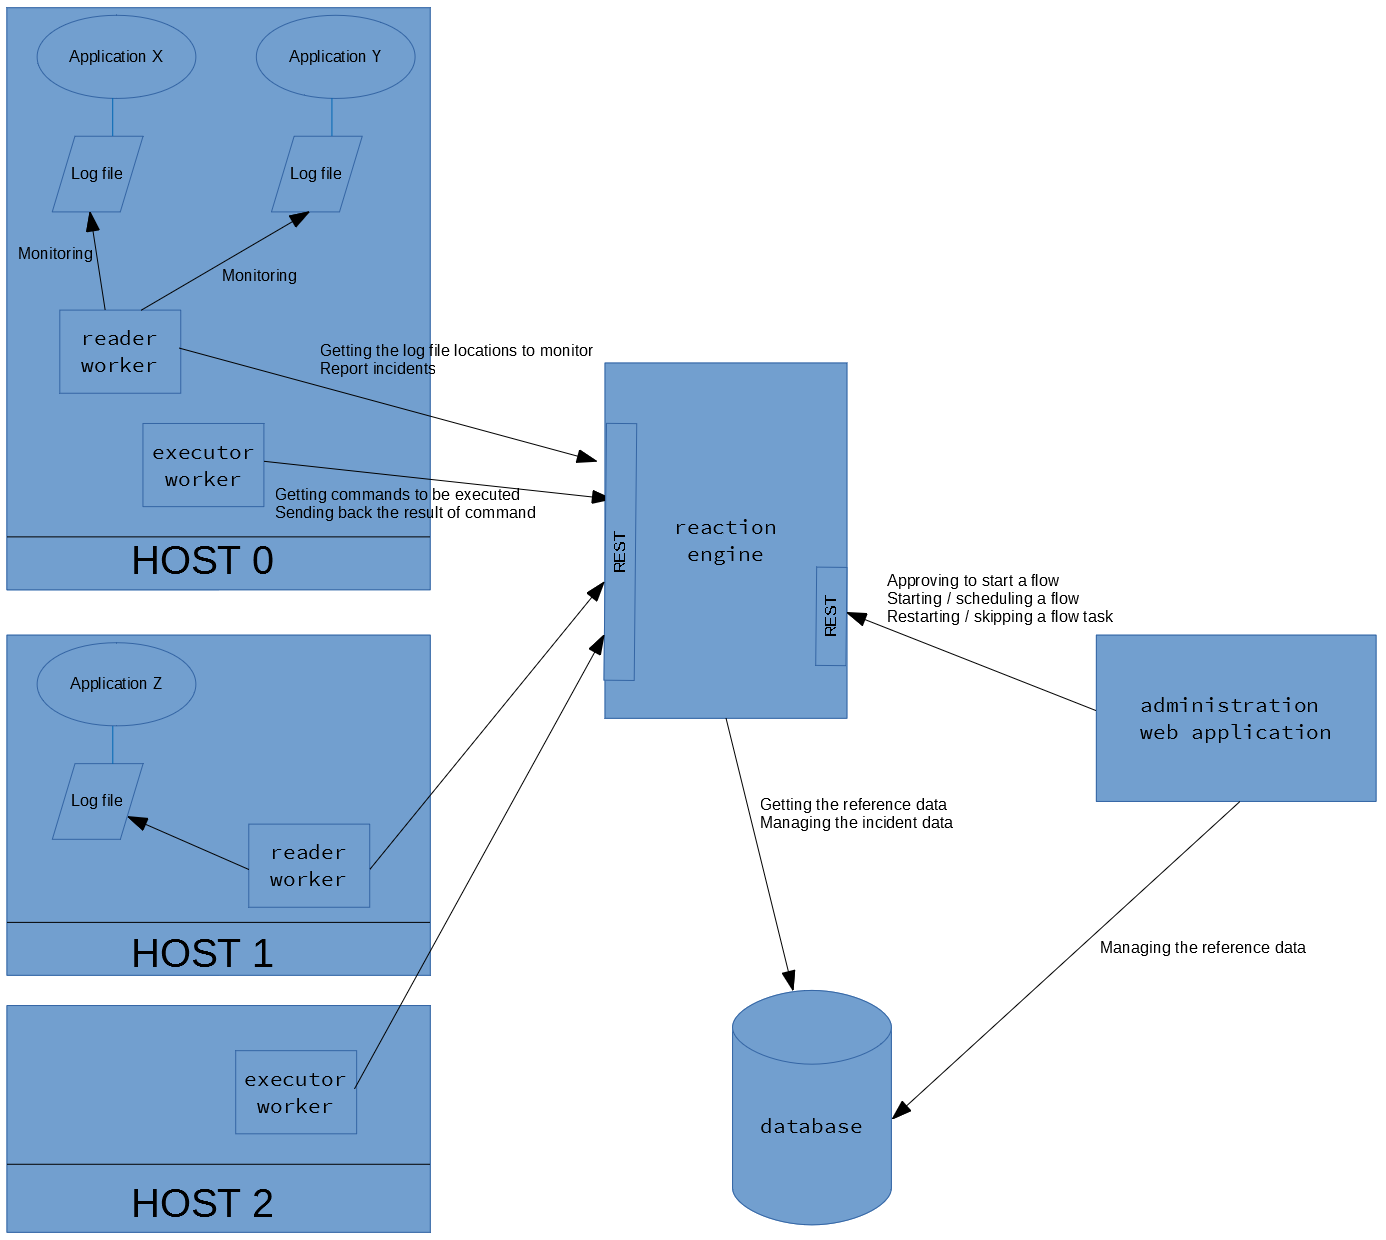
The administrator user can manage the reference data (see later) and maintain the started, scheduled execution flows in the administration web application. Also the application communicates to the Reaction engine (start a flow manually, schedule it, etc.) via REST.
The Reaction engine manages the events (started, scheduled execution flows) in database, receives new incidents from the reader worker, waiting for the result of the executed OS commands on the executer worker, etc. (via REST)
The reader worker examines the log file and report incidents (via REST), the executor worker execute OS commands and send its result to the Engine (via REST).
The Reaction Engine and the Administration web application have to be
deployed to the server machine(s), the workers should be installed to
the host machines where the applications' log files reside.
The
Engine is a Java application and tested on Tomcat 8, on Wildfly 10 and
on Weblogic 12. The admin web application is a python web application
and tested on Apache (with mod_wsgi).
The reader worker has to be started on all the hosts where those systems run whose log files have to be monitored. The executor worker has to be started on the host machines which are involved in any of the execution flows (i.e. where external commands have to be executed).
After the deployment of the engine and the admin web application and the start of the workers only the administration web application has to be used to manage the reference data. All the data synchronisation, etc. will be done in the background, automatically. If a new host has to be monitored or involved in the execution flow then the worker RPM has to be installed, configured it via the config file and specify the data in the admin web application.
1.3. Licensing
All the Reaction components are under AGPL-3.0 license.
2. Components
2.1. Worker
2.1.1. Quick introduction
The workers are to monitor the log files, report an incident, execute an operation system command and send back the result of the command.
2.1.2. How to install
The installation is different on Linux and on Windows (please see below).
After the installation the configuration is the same i.e. the configuration file (conf/worker.yml) has to be set up properly, the following 2 settings have to be set properly to make the worker work (the other settings are important too but these 2 are vital):
Please add the credential (security/credential) for the REST authentication (it contains only the password, the name of the worker from the conf/worker.yml file will be used as user name).
Also please set the .sh / .bat files correctly. The values that have to be altered are at the beginning of the file (in the VALUES TO BE CHANGED section).
The worker needs at least Java 8 to run.
The worker can be used in Linux and in Windows. Both the reader and the executor have the same options so only describe the reader worker.
2.1.2.1. on Linux
In Linux RPM is provided: reaction-worker-1.1-1.el7.noarch.rpm
The RPM can be installed as follows:
sudo rpm -i reaction-worker-1.1-1.el7.noarch.rpmsudo rpm -i --prefix=/tmp/reaction/worker reaction-worker-1.1-1.el7.noarch.rpmOn Ubuntu the RPM can be installed with alien:
sudo alien -i reaction-worker-1.1-1.el7.noarch.rpm --scriptsThe worker has to run as root. Please don't forget to change the owner of the worker directory and the files in it to root! For example:
chown -R root worker-1.1The jsvc has to be on the host machine and the path has to be set properly in reaction_executor.sh and reaction_reader.sh files.
Executing the worker without parameters it will enlist the available options.
ric_flair@mylaptop:/local/reaction/worker-1.1> sudo ./reaction_reader.sh
[sudo] password for vikhor:
Usage: sudo ./reaction_reader.sh {start|stop|restart|status}- start: Starting the worker in the background. At the beginning the reader worker will get the log file locations (which are defined in the admin web application) or the executor worker will get the commands to be executed immediately. If the start wasn't successful then check the error in the log folder.
- stop: Stopping the worker.
- restart: Restarting the worker.
- status: Displaying if the worker is started and other information like PID, config file locations, worker's log file location.
2.1.2.2. on Windows
The installation is different on Windows. Copy the zip to the host machine and extract it.
On Windows the worker has to be installed as service so the options are different:
c:\work\reaction\worker>reaction_reader.bat
"Usage: reaction_reader.bat {install|deinstall|start|stop}"- install: Install the worker as service (the worker won't be started). The name of the service comes from the NAME variable in manage_XXX.bat.
- deinstall: Uninstall the worker as service
- start: Start the installed worker service (the installed worker can be started with the Services windows program too).
- stop: Stop the installed worker service (the installed worker can be stopped with the Services windows program too).
2.1.3. Communication
The following section is about how the Reaction components communicate to each other.2.1.3.1. Retry
There are two 2 types of calls being sent from the worker to the engine that are crucial to be sent or at least everything must try to complete them:
- reporting an incident (not doing so a possible incident might be lost)
- sending back the result of the OS command (not doing so an execution flow will be interrupted as it will wait for the result forever)

If the engine is not available (it is restarted for example) then these calls have to be retried. A queue of the messages to be sent will be created and all these requests will be put to this queue until the back-end is online again.
The messages will be removed from this queue if
- the message is sent (the engine is available again)
- the message is too old (expired) -> it can configured (application.reader.call.validity_interval and application.executor.call.validity_interval)
If the number of the events in the queue is higher than the capacity of the queue then the new message won't be put to the queue. It is worth to mention the retry mechanism will occur in a separate thread so it won't interfere with the main processing.
Also it can be configured how much time the retry mechanism has to wait between two attempts (see application.reader.call.sleeping and application.executor.call.sleeping).
2.1.3.2. Security
Authentication
If the worker calls the engine then first it has to authenticate itself. HMAC authentication is used i.e. the clean-text password is not sent (HTTPS is not needed) and it cannot be decrypted as it is not a static hash. Also it is protected from replay attack by checking timestamp of the HTTP request (not to be too old, reaction.security.nonce.delay) and by storing the unique nonce value which is sent in every HTTP request and checking if the current nonce value is already sent previously (the size of this nonce list can be controlled by reaction.security.nonce.limit).
The password can be specified in security/credential file (the name of the worker from the conf/worker.yml file will be used as user name). The same credential has to be stored in the engine too (in the credentials file, see later).
Message encryption
Message-level encryption can be utilised which has the advantage over
HTTPS that it can go through any firewall / router without remaking the
HTTPS connection (and maintaining the credentials on these stations,
etc.).
Three types of encryption can be used:
- NONE
no encryption - CREDENTIAL_BASED
symmetric encryption, only a string key will be the base of the encryption
the key will be taken from security/credential file i.e. the same key (password) is used for authentication and encryption - CERTIFICATE_BASED
asymmetric encryption i.e. public and private keys are used to encrypt the REST call
the details of the keystore (the certificate (private key) of the client (worker)) and truststore (the certificate (public key) of the server (engine)) have to be added to rest_call.encryption.keystore and rest_call.encryption.truststore : the certificates (public keys of workers and private key of engine) have to be installed on server's side too
how the CERTIFICATE_BASED encryption works is as follows: first a key is generated (its size can be specified with rest_call.encryption.key_size) to use symmetric encyption to encrypt the payload and the public key in truststore will be used to encrypt this key and send it to the other side
2.1.4. Reader worker
The reader gets the log file locations (via REST) that have to be monitored from the engine (doing it automatically in every X sec), it constantly monitors the log file(s) and examines every line that are put to the log file. An incident will be reported to the engine if the pattern is found in the line.
It is important that the reader worker queries the active error detectors when trying to get the log file locations. So the log file will be monitored only if an active error detector is created with the system (log file).
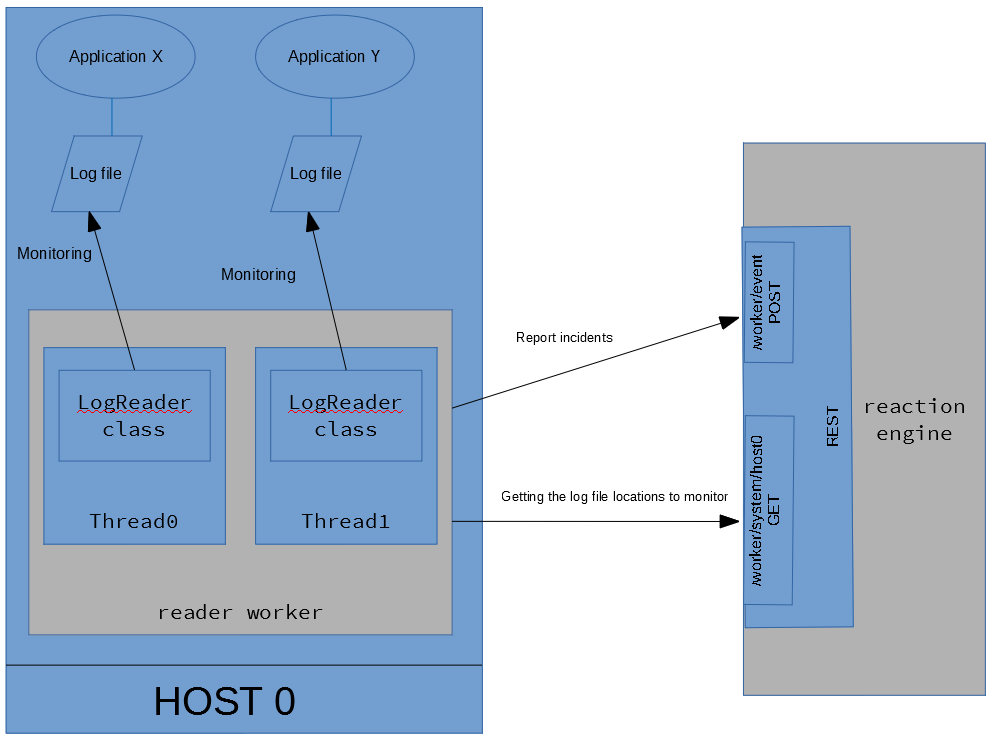
The reader starts as many threads as the count of the log files are to be monitored.
As it was mentioned before the synchronisation (getting the log file
locations) is automatic (it can be configured how often the reaction
engine is called by the reader).
When there was a change (i.e. the
log file location is modified in the management web app) then the
current thread that monitors the log file has to be stopped and a new
one has to be started with the new location. No new line in the log file
will be missed while stopping the old thread and starting a new one.
It is important to note that the OS (e.g. UNIX) user that runs the reader worker (usually it is the 'root' user) must be able to read the file and the parent folders of the file must have read+execute permission!
2.1.5. Executor worker
The executor executes the OS command (that is defined in the execution flow) and sends back the result to the engine. It is recommended to set the executor to call the engine regularly to check if there is a command to be executed so the flow execution will be performed smoothly.
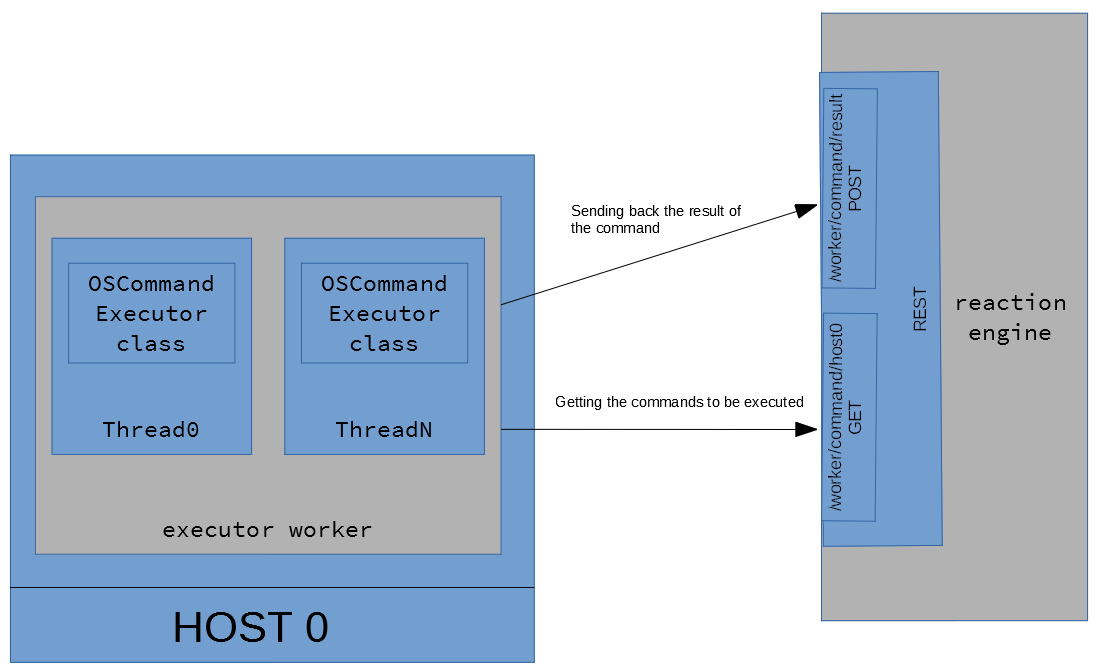
It is possible that more than one command is sent by the engine to execute.
If
the commands are different then they will be executed parallel. If 2 or
more commands are the same then they will run sequentially (no to disrupt each other).
For
example: the following commands arrive (command-C, user-U, pattern-P):
(C1, U1, P1) and (C2, U1, P2) and (C1, U1, P1) => 2 threads will be
started and one of the threads will execute 2 commands.
The executor performs command and usually every command has an output. The executor can do 2 things with the output:
- capture the last 15 lines and send back to the engine (and the engine will store these lines for the event and they can be viewed on the admin web GUI)
- if an output pattern is defined for the command then it tries to match this regular expression to every line and send back the last match as an extracted output value
2.1.6. Configuration file
The location of the configuration file is conf/worker.yml. The content is as follows:
| host_name | the name of the machine it is important that it has to match with the value of the host property of the system specified in the admin web applications (system / host) it can be anything but highly recommended to use the real name of the host |
| rest_call.engine_endpoint | the endpoint of the Reaction Engine that is used by the REST client sample value: http://localhost:7003/reaction-engine |
| rest_call.url_read_timeout | the read timeout in millisecond is the timeout on waiting to read data specifically if the server fails to send a byte after X seconds, a read timeout error will be raised sample value: 5000 |
| rest_call.url_connection_timeout | the connection timeout in millisecond is the timeout in making the
initial connection; i.e. completing the TCP connection handshake sample value: 1000 |
| rest_call.credential.file | the location of the credential file that contains the password for authenticating against the REST service of the Reaction Engine - file can be used from classpath: classpath:credential - file with absolute path can be used: file:/local/reaction/worker/security/credential sample value: classpath:credential |
| rest_call.encryption.type |
specifying if the encryption will be symmetric (credential-based) or asymmetric (certificate-based)
|
| rest_call.encryption.key_size | the key size in bits The maximum size can be 128 bit by default. If AES 256 or AES 512 has to be used then the JDK has to be upgraded with Java Cryptography Extension (JCE) - (search for jdk jce aes 256 in google). If AES 256 or AES 512 is used than the server must be ready to handle it too! (i.e. the JDK on the server has to be updated too) sample value: 128 |
| rest_call.encryption.transformation | the name of the transformation For more info please see: https://docs.oracle.com/javase/7/docs/technotes/guides/security/StandardNames.html#Cipher. sample value: AES |
| rest_call.encryption.keystore.location | the location of the keystore where the private key of the Reaction Worker resides to decrypt the message only required if CREDENTIAL-BASED encryption is used file: or classpath: prefixes can be used sample value: file:/local/reaction/worker/ACME00/security/clientkeystore.jck |
| rest_call.encryption.keystore.password | the password of the keystore only required if CREDENTIAL-BASED encryption is used sample value: password |
| rest_call.encryption.keystore.type | the type of the keystore only required if CREDENTIAL-BASED encryption is used sample value: JCEKS |
| rest_call.encryption.keystore.key_alias | the alias in the keystore that points to the certificate only required if CREDENTIAL-BASED encryption is used sample value: client |
| rest_call.encryption.truststore.location | the location of the truststore where the public key of the Reaction Engine is to encrypt the message only required if CREDENTIAL-BASED encryption is used file: or classpath: prefixes can be used sample value: file:/local/reaction/worker/ACME00/security/clienttruststore.jck |
| rest_call.encryption.truststore.password | the password of the truststore only required if CREDENTIAL-BASED encryption is used sample value: password |
| rest_call.encryption.truststore.type | the type of the truststore only required if CREDENTIAL-BASED encryption is used sample value: JCEKS |
| rest_call.encryption.truststore.key_alias | the alias in the truststore that points to the certificate only required if CREDENTIAL-BASED encryption is used sample value: server |
| application.reader.sleeping | the reader waits for the specified number of seconds until it tries to get the system list again sample value: 100 |
| application.reader.multiline_error_supported |
It is possible that the header doesn't exist at the beginning of each lines, e.g.
|
| application.reader.file_system_check_interval | the amount of time in milliseconds to wait between reading of the file system when monitoring the log file to check if it is changed sample value: 800 |
| application.reader.log_charset | the charset of the log file it can be checked with the command file -i <logfile location> sample value: US-ASCII |
| application.reader.call.queue_capacity | capacity of the queue when retry is needed When the engine back-end is offline the events that have to be reported mustn't be lost - the reportEvent REST call is retried until
The event is removed from the queue if the call is successful. If too many events arrive then the queue can be overflown. (e.g. the capacity is 8, the REST call needs 0.5 sec to finish and 10 new events arrive in 0.5 then 2 events will be lost -> the following entry can be seen in the log: "The following record is not added to the queue as it hits the limit...") sample value: 10000 |
| application.reader.call.validity_interval | how long will an possible incident (event) be valid if the engine is offline (in sec) I.e. there is an OutOfMemoryError in the log so a server should be restarted but the reaction engine is offline -> it is not a valid scenario that the server will be restarted 2 days later because the event is valid forever sample value: 1200 |
| application.reader.call.sleeping | if the reaction engine is offline the reader tries to resend the
possible incident, the sleeping time can be set how much time to wait
between two calls (in millisecond) sample value: 3000 |
| application.executor.sleeping | the executor waits for the specified number of seconds until it tries to get the commands from the Engine to be executed sample value: 4 |
| application.executor.max_nr_running_commands | the maximum number of the running commands The commands to be executed will run parallel in different threads. The setting tells how many threads can be started. sample value: 20 |
| application.executor.call.queue_capacity | see at application.reader.call.queue_capacity |
| application.executor.call.validity_interval | after the execution of a command the result (if successful, output, etc.) has to be sent back to the reaction engine if the engine is offline then the result will be resent but it needs a validity interval (in sec) similar to application.reader.call.validity_interval sample value: 3600 |
| application.executor.call.sleeping | the executor waits for the specified number of milliseconds until it
tries to send the result of the executed command (in millisecond) sample value: 3000 |
2.1.7. Folder
Log file
The log file can be found in the log folder. The worker-reader.log file contains the log entries that the reader worker produce, the worker-executor.log file contains the logs that belong to the executor.
The logs can be configured runtime (without starting / stopping the worker) by altering the conf/logback.xml file, after a few sec (default 15 sec, configured in the same file : scanPeriod="15 seconds") the changes will be picked up.
There are 2 other log files in the log folder:
- [worker name].out
- [worker name].err
(the [worker name] is configured in reaction_*.sh / reaction_*.bat files - see NAME variable). They are maintained by jsvc (in Linux) / prunsrv.exe (in Windows) program that starts / stops the worker. These files can contain additional information if the worker couldn't be started / stopped.
It is important to add write/execution permission on the log folder for the Linux user that runs the specific worker!
Security
The following 3 files might be found in the folder:
- credential: The file contains the credential (password) for REST authentication. The username + password must be found in the credential file of the Reaction Engine too.
- clientkeystore.jck: If CERTIFICATE_BASED encryption is chosen then this keystore contains the client (the worker) certificate (private key).
- clienttruststore.jck: If CERTIFICATE_BASED encryption is selected then this truststore contains the server (the engine) certificate (public key).
Dependencies
All the JAR files that the workers need can be found in the lib folder.
Configuration
The worker configuration file and the logging configuration file are in the conf folder.
2.2. Reaction Engine
2.2.1. What does it do?
The engine's tasks are as follows:
- communicating with the workers (see the communication diagrams of reader and executor) - providing REST interface to be called
- executing the execution flow
- communication with the management web GUI - providing REST interface to be called
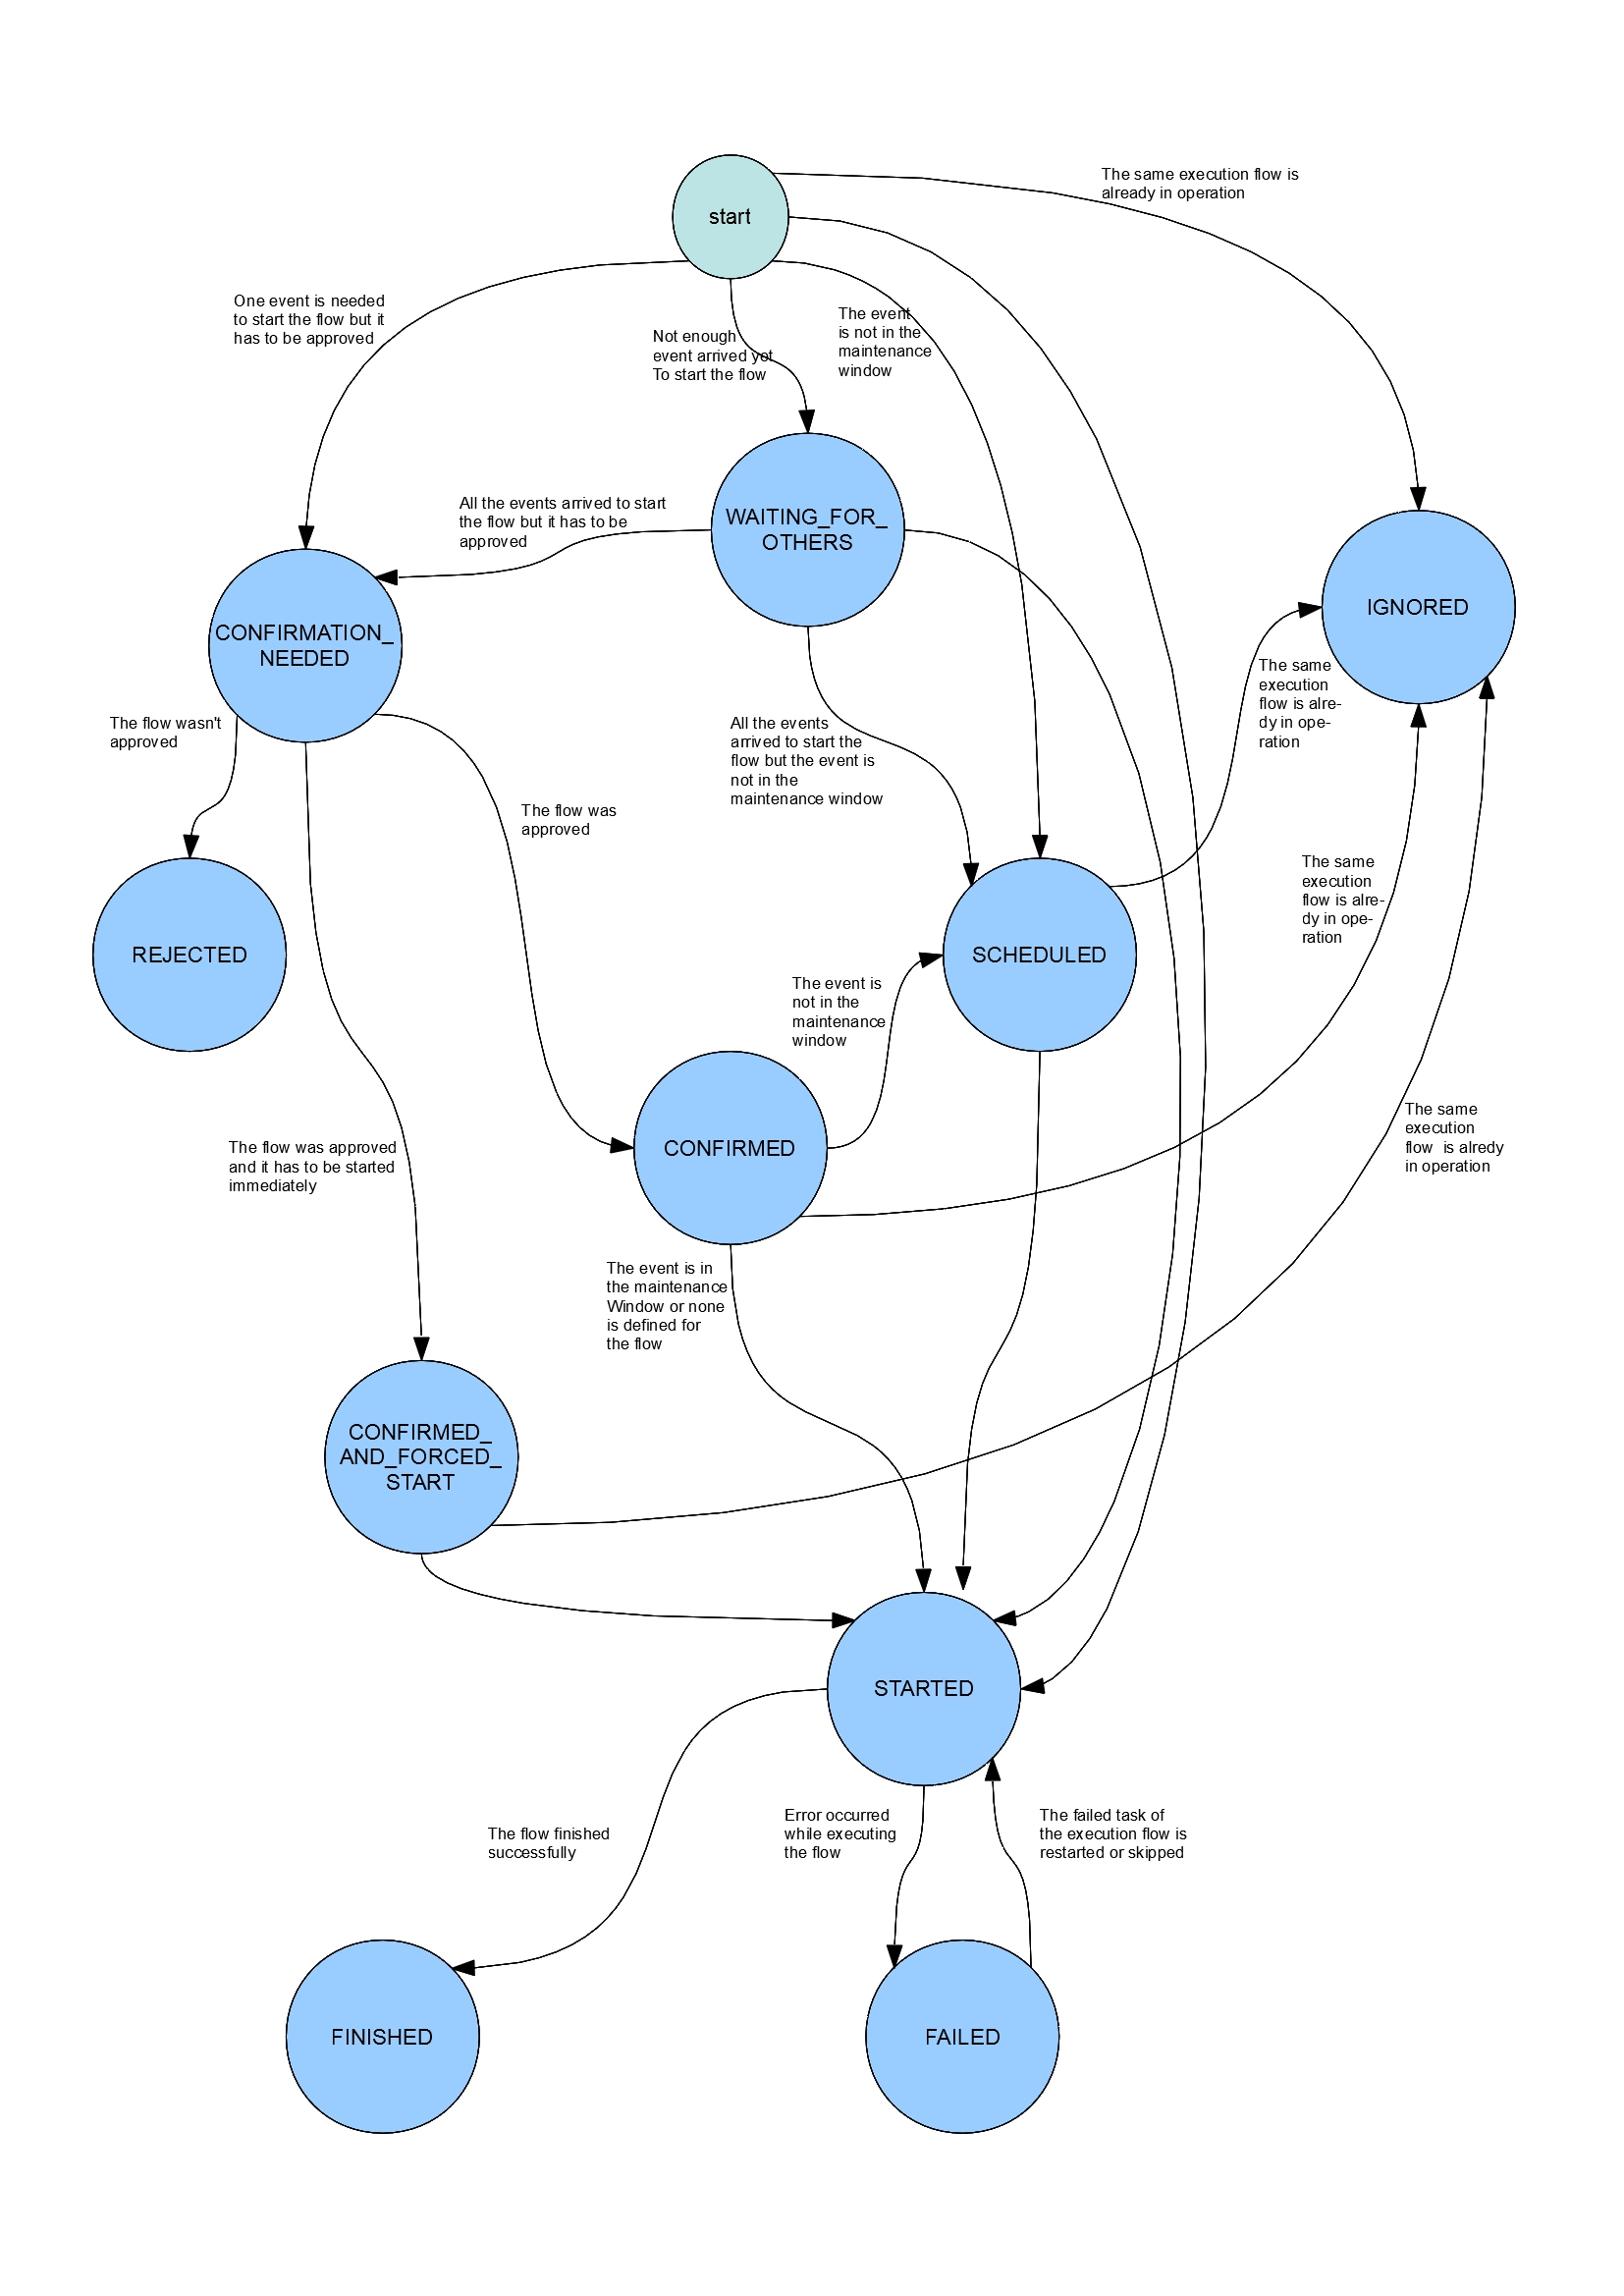
2.2.2. State transition
The event of the execution flow can have different states while running. The state transition can be seen on the following diagram:
The process starts when the workers reports an incident (i.e. it
finds a match to the pattern in the log file - the pattern is a
regular expression like .*OutOfMemoryError [0-9]+.*).
The engine tries to find a matching error detector (see more information about the error detector in the reference data).
It basically means that it looks for an error detector that
- has a pattern that matches the log text sent by the worker
- has a system that has a host property which matches the machine where the log was sent from and the log file location are the same
Be aware that the system might have hierarchy so it might find an error detector whose owns a system that has children and one of the children will fullfill the requirements above (there is a Hermes CRM system and it has 2 server instances, Hermes web 0 and Hermes web 1 - if the Hermes CRM system is assigned to the error detector then both servers will be examined).
If it cannot find the matching error detector then the event won't processed (saved) but indicating in the log of the engine that it is ignored (no event will be created).
If it finds an error detector record then one of the following scenarios can happen:
- the same execution flow is already in operation so this event will
be ignored (however it will be stored to the database with IGNORED
status)
the following logic will be applied:IF [the status of the other flow which is in operation is FINISHED or FAILED] AND [(the end date of this other flow) + (timeBetweenExecutions (see reference data) of the current execution flow) >= (current date)] THEN
the execution flow cannot be started as the time limit has already passed when a new flow cannot be started -> IGNORED status
(for example: the application servers have been just restarted and we don't want to restarted them in every minute (but max. in every 15 mins) but this new incident arrived in 15 mins then this new incident will be ignored)
ELSE IF [the status of the other execution flow (in operation) is STARTED] THEN
the execution flow cannot be started -> IGNORED status
(it doesn't make any sense to start 2 flow parallel...)
ELSE
processing goes on (start / schedule the flow) - if multiple event is needed to start the flow and not enough event arrived yet then the status of the event will be WAITING_FOR_EVENT (i.e. 3 ImportException error is needed to start the flow and the current event (ImportExdception) was only the 1st or 2nd)
- if all the events arrived to start the flow or one event is needed only but the flow has to be approved manually before starting it then the event will have the CONFIRMATION_NEEDED status
- if no confirmation is needed but maintenance window is defined for the system and currently we are not in that window then the flow has to be scheduled -> SCHEDULED status
- if no maintenance window is defined for the system then the flow can be started -> STARTED status
As per the state diagram from the WAITING_FOR_OTHERS state the event can go to
- CONFIRMATION_NEEDED : if the flow has to be approved
- SCHEDULED: if maintenance window is specified and we are not in it
- STARTED
The flow can be rejected ( -> REJECTED) or approved. If the normal
approval is chosen on the web application then the event has to be
scheduled (-> not in the maintenance window) or started. If the flow
is forced to start (CONFIRMED_AND_FORCED_START) then it will be started
immediately regardless if we are in the maintenance window (if there is
any defined at all).
The CONFIRMED and CONFIRMED_AND_FORCED_START will be IGNORED if there is already a flow being in STARTED status.
A SCHEDULED flow will be started if the specific time arrived. Before
starting the flow it will be checked if another instance of the same
flow is started. If it is then this event will be IGNORED.
The event to be scheduled will be IGNORED in that case too if there is
another flow being scheduled for the same day. If it is scheduled for
another day then the current event is going to be scheduled.
It is important to note that the flow is not always to be scheduled to
run at the beginning of the maintenance window. Let's say the window
starts at 7PM, a flow ended at 6:45PM whose timeBetweenExecutions is 40
mins. An event (which would trigger the same flow) arrives at 6:55PM
which will be scheduled to run at 7:25PM (and not 7PM!).
If something goes wrong in a started the flow then the flow goes to FAILED status which might mean the end of the flow. The flow can go back to STARTED from FAILED if the failed task is restarted on the web application or the failed task is skipped.
If everything went well then the event will have the FINISHED status which means that the flow ran successfully.
Please be aware that the manually started flows (which have to be started now and not scheduled) wont be ever IGNORED!
2.2.3. Reference data
The reference data is the base information that the Reaction Engine can work from, it can be managed in the Management Web GUI.
There are 3 base data type: system, execution flow, error detector.
Other information is produced by the Reaction engine:
- events: when an incident is reported by the worker or a flow is executed/scheduled manually then an event is created to maintain the execution states, data of the flow
- event life: as the flow is composed of tasks so the events must have smaller blocks that store the statuses of the execution of the individual tasks -> event life
- scheduled execution flow: the execution flows that are scheduled by the Scheduler
2.2.3.1 System
Here the log file locations and the related information are stored.
It is important that the reader worker won't get the log file location
until there is an active error detector specified which is assigned to
this system (i.e. if only a system is defined here which contains the
host and the log file location but an error detector which has the
system is not created then the reader worker won't get the location so
it won't monitor the log file)!
Hierarchy of systems can be built so parent system can be created and attached the log file locations to it.
For example: the Hermes CRM application has 2 web application servers
and 2 backend (REST, SOA, etc) servers and one log files to be monitored
per server. So the following hierarchy can be built:
Hermes
Hermes web
Hermes web 0
Hermes web 1
Hermes backend
Hermes backend 0
Hermes backend 1
The following properties can be set on higher level (on parent system) and the children will inherit them:
host, log header pattern enabled, log header pattern, log level, log file location, maintenance window
For example the log header pattern is the same for Hermes web 0 and Hermes web 1 so it can be added to Hermes web
(the log header pattern has to leave empty at the children). The
maintenance window is the same for all servers so it is defined Hermes
only (the maintenance window has to leave empty at the children).
| Name | the name of the system |
| Description | the description of the system |
| Host | the host where the system (log file) resides It can be any text but it has to be equal to the host name defined in the config file of the worker (2.1.6. Configuration file -> host_name) |
| Parent system | the parent of the current system |
| Log file path |
the log file location |
| Log level | Usually every log entry has a log level, like INFO, ERROR, etc. It
can be set what the minimum level is that the worker will take into
account to report. For example: we are only interested in the warning and above logs (i.e. if something is logged with DEBUG level even if there would be a match it won't be considered by the worker as an incident) so set it to WARN. Even if the pattern in the error detector matches the log entry and the matching log entry's log level is INFO then it won't be reported as the log level of the system is WARN. However the ERROR log entries will be examined! Be aware if the log level has to be examined then the log header pattern has to be specified on this system or on any of its parents! Possible values: TRACE, DEBUG, INFO, WARN, ERROR, FATAL |
| Log header pattern | Usually every log entry in Log file path has a header. For example: <Nov 10, 2017 3:12:34,698 PM CET> <Notice> <WebLogicServer> <BEA-000396>. It needs to define if the Log level property is set. (how? -> see later at web GUI) |
| Type | Three possible values are Application, Group and Log file. In the example above the 'Hermes' would be an Application, the 'Hermes web' a Group and 'Hermes web 0' would be a Log file. It is important to mention that only Log file systems will be sent back to the reader worker when it gets the list of systems (log file locations). It means if a GROUP system is assigned to the error detector then all the log files of the children (and the0ir children, etc.) systems will be monitored by the reader worker. For example: if the Hermes web system is assigned to an error detector then both the workers on the Hermes web 0 and Hermes web 1 hosts will get the log file locations to monitor |
| Maintenance window | Time periods can be defined when the execution flow cannot be executed so it will be scheduled outside the window. For example: the maintenance window is 22:30-05:30 and the incident is reported at 12:30 then the flow will scheduled to run at 22:30 (the flow can be forced to run immediately if the confirmation needed option is set on error detector and during the confirmation the 'confirmed and forced started' option is chosen on web GUI). You can enter date range like 20:00-23:00, 23:30-06:00. More date ranges can be set separated by comma. The date ranges can overflow to the following day. E.g. Mon: 23:00-04:00 If no maintenance window is set for a day then no execution flow can run on that day. If you set the 00:00-24:00 for one day then the window is open on the whole day for that day. The 19:00-23:59 means that the maintenance window is open between 7PM and the end of the day (i.e. it is open at 23:59:59,999 too). WARNING! If you don't specify any date range (for none of the days) then the window is open on each day all day! If you define the following time ranges for Monday 23:00-02:00, 04:00-05:30 then it means that the maintenance window will be open on Monday morning between 04:00 and 05:30 and on Monday night between 23:00-24:00 and on Tuesday morning between 00:00-02:00. |
2.2.3.2. Execution flow
It is a series of tasks that are executed one after another. Operation system commands can be executed or email can be sent, it can contain branching (if-else condition) or the flow can be terminated.
The properties of the execution flow reference data:| Name | the name of the execution flow When creating a new version of the flow by copying it then it is recommended to add the version number at the end. For example: Restart Hermes servers - v2 |
| Period between executions | how many seconds does the engine have to wait to run the same flow again Sometimes it is not recommended to execute the same flow (i.e. restart a server) in every minute... |
| Approximate execution time | the approximate execution time of the flow If it is long running flow then it shouldn't be executed just before the end of the maintenance window (i.e. the execution time is 60 min, the maintenance window is between 19:00 and 23:30 and the event occurred at 22:50 then it won't be executed). If it cannot be executed on a specific day then it will be rescheduled. If an event arrives at 02:40, the maintenance window is open between 01:00 and 03:00 so theoretically the flow can be executed but the execution time of the flow is 30 min so it won't finish by 03:00 then the flow will be scheduled to run on the next day. |
| Access group | groups of users can be set who can monitor, change the execution flow, etc. For example: the execution flow Restart the Weblogic app server won't be interesting for DBAs or UNIX specialist or they are not permitted to see them at all! In the config file of the web GUI all the groups can be specified and they can be attached to the users on the user admin page ([host]:[port]/[context root]/admin) of web GUI. The users in other group won't be able to see the flow in monitoring, statistics, etc. in the web GUI. |
| If an error occurs then send mail to the following email address(es) | If an unexpected error occurs then a mail will be sent to these email addresses. More email addresses can be specified separated by comma. If the field is left empty then mail will be sent to all the users that share the access groups that are assigned to the execution flow (e.g. the DBA access group is assigned to the X flow then all the users will receive mail that are in the DBA group in Django authentication). |
| If the flow is started (automatically) by a log event then send mail to the following email address(es) | If a flow is started by an incident reported by the reader worker then send mail to these mail addresses. The same rule apply here as above. |
2.2.3.3. Execution flow task
The image below shows a sample execution flow that contains external (OS) commands (green rectangles), mail sending tasks (gray circles), if-else conditions (yellow diamonds) and failure tasks (red flag). It is a detailed flow of restarting a Weblogic AdminServer.

Every task must have a name. The names mustn't be the same on the same level.
There 4 types of task:
external command execution
This task is for executing an OS (operating system) command on a host where the specific executor worker runs. The command execution was tested on Linux and on Windows.
| Command | the command that will be executed on the host Any command can be specified that the operating system can execute. For example: . /local/wls12213/user_projects/domains/base_domain/bin/setDomainEnv.sh && echo "nmConnect('weblogic','weblogic','localhost','5556','base_domain','/local/wls12213/user_projects/domains/base_domain','plain')" | java weblogic.WLST (This command will set the environment variables of the Weblogic domain and will connect to the nodemanager) Please be aware that on Windows if the command to be executed doesn't give the control back after being executed (e.g. the command is to start an application server which keeps waiting for requests so it won't end) then the command won't finish i.e. the flow won't fail but won't finish either but it will be stuck. The recommendation is to use Windows service in this case. If Linux shell built-in command has to be used (like [ -d /tmp/reactionflow ] && echo ...) then please always specify the OS user (even if it is not different from the user who runs the worker; e.g. root user)! If the OS user is set then the command will be executed with bash -c so the shell built-in will be interpreted correctly. Also if you want to execute nested command (with the back-quote character, like echo "Current time:`date +%Y%m%d%H%M%S`") then also recommended to use the bash -c (i.e. specifying the OS user). MANDATORY |
| OS user | the operating system (OS) user can be set that will run the command (used on Linux only) The executor worker runs as root so by default the root user will execute the command set above. If we want the command to be executed by another OS user then it can be set here. Please be aware that the root user must be able to log in to the specific user seamlessly (e.g. root -> [other user]). If a user is set then the following OS command will be executed: sudo -u [user] bash -c "[command]" |
| Host | the host where the command has to be executed It can be any text but it has to be equal to the host name defined in the config file of the worker (2.1.6. Configuration file -> host_name) MANDATORY |
| Output pattern | the output pattern that is used to get the value to be extracted
from the output of the external command and to be used to evaluate the
subsequent if-else condition Usually every command has an output, like ... [sql] Executing resource: /home/build/generated/sql/oracle/gen_create_synonyms.sql [sql] Executing resource: /home/build/generated/sql/oracle/gen_create_synonyms_customized_views.sql [sql] 257 of 257 SQL statements executed successfully If we want a logic like if the SQL command execution was successful then execute another command otherwise send a mail to a user then
|
if-else condition
Evaluating an if-else condition.
An external command has to precede the if-else operation if the condition contains the $COMMAND_OUTPUT text.
For example: Integer.parseInt($COMMAND_OUTPUT)==4
| Expression | the condition of the if-else operation that can contain janino expression Please see more about the expressions HERE. MANDATORY |
mail sending task
Sending a mail.
| Recipients | the recipients of the mail separated by comma MANDATORY |
| Subject | the subject of the mail MANDATORY |
| Content | the content of the mail HTML content can be sent too MANDATORY |
failure task
The flow will be interrupted and marked it as FAILED.
2.2.3.3.1. Condition of IF-ELSE
The condition can be specified in Java programming language that is compiled and evaluated by Janino. Only expressions can be written so Java methods, classes, etc. cannot be specified. The output of the previously executed external command can be used by adding the $COMMAND_OUTPUT text in the expression like$COMMAND_OUTPUT.equals("RUNNING")Integer.parseInt($COMMAND_OUTPUT)Logical operators
Logical operators can be also used as follows:- AND: using the && operator
(the $COMMAND_OUTPUT text converted to number must be between 5 and 9)Integer.parseInt($COMMAND_OUTPUT) > 4 && Integer.parseInt($COMMAND_OUTPUT) < 10 - OR: using the || operator
(the $COMMAND_OUTPUT text must be equal to 'a' or 'b')$COMMAND_OUTPUT.equals("a") || $COMMAND_OUTPUT.equals("b") - NOT: using the ! operator
!$COMMAND_OUTPUT.equals("a") - mixed: please be aware that the AND operator has priority over OR!
(the $COMMAND_OUTPUT text converted to number must be equal to 5, 7,8 or 9)Integer.parseInt($COMMAND_OUTPUT) != 6 && (Integer.parseInt($COMMAND_OUTPUT) > 4 && Integer.parseInt($COMMAND_OUTPUT) < 10)
Text operations
IMPORTANT! When comparing 2 strings to each other then the operator == mustn't be used but use the equals(...) method instead!$COMMAND_OUTPUT.equals("RUNNING")$COMMAND_OUTPUT.toUpperCase().contains("FAIL")Date operations
If the output of the previously executed external command is a date (or datetime) then first the date text has to be converted to date and then comapring it to another date.For example: converting the text to datetime using the pattern dd/MM/yyyy HH:mm:ss (e.g. 13/12/2018 15:34:00) and checking if it after the current date (more information about the datetime pattern can be found on https://docs.oracle.com/javase/8/docs/api/index.html?java/time/format/DateTimeFormatter.html
java.time.LocalDateTime.parse( $COMMAND_OUTPUT, java.time.format.DateTimeFormatter.ofPattern("dd/MM/yyyy HH:mm:ss") ).isAfter( java.time.LocalDateTime.now() )Number operations
The output of the external command can be converted to number too. The following number types are worth to be used:| Data type | Description | Range | Conversion |
|---|---|---|---|
| Integer | 32-bit signed integer | -2,147,483,648 - 2,147,483,647 | Integer.parseInt($COMMAND_OUTPUT) |
| Long | 64-bit signed integer | -9,223,372,036,854,775,808 - 9,223,372,036,854,775,807 | Long.parseLong($COMMAND_OUTPUT) |
| Float | single-precision 32-bit IEEE 754 floating point | 1.4e-45f - 3.4028235e+38f | Float.parseFloat($COMMAND_OUTPUT) |
| Double | double-precision 64-bit IEEE 754 floating point | 4.9e-324 - 1.7976931348623157e+308 | Double.parseDouble($COMMAND_OUTPUT) |
2.2.3.4. Error detector
In the error detector you can define where you want to search (system, i.e. log file location) for what (the message pattern which is a regular expression) and what to do if you found it (execution flow).
For example: There is a memory leak in the Hermes backend application (which is deployed to Hermes backend 0 and Hermes backend 1) which results java.lang.OutOfMemoryError: PermGen space error message.
So define an error detector with the pattern like .*java.lang.OutOfMemoryError: PermGen space.*, assign the Hermes backend system to it (I assigned the Hermes backend and not the Hermes backend 0 nor Hermes backend 1! So only one error detector has to be specified but both reader workers on the hosts of Hermes backend 0 and Hermes backend 1 will get the log file location to monitor.) and choose the execution flow to be executed.
| Name | the name of the error detector |
| Message pattern | regular expression that the reader worker will use to check against the log file line by line |
| The number of events needed to start the execution | Sometimes only one event is not enough to start the flow. Let's say there is a NullPointerException
in the log but we don't get scared if we see one but if the 2nd or 3rd
arrives in a specific timeframe then we might have a situation. Here we can define how many events should be reported before doing anything. |
| Timeframe while the events have to arrive | the timeframe that the events (their number is defined above) have to arrive within for example: to start the execution flow 3 incidents have to be reported by the reader in 15 mins |
| Confirmation needed | If manual confirmation (approval) is needed by a user on web GUI before starting the flow then set it true. |
| Activated | An error detector is taken into account to reporting an incident if it is active. If it is not active then the log file location and the message pattern assigned to it won't be sent to the reader worker(s). |
2.2.4. Architecture
The reaction engine is a Java web application that is tested as a standalone application and on
Tomcat 8, Wildfly 10 and Weblogic 12 (separate WAR files are shipped for each application servers).
It has REST interface to communicate with the workers (see above) and with the web GUI
(both needs HMAC authentication and secure communication can be switched
on for the worker). Also it communicates with the database via JDBC.
In case of heavy load the engine can be clustered or just use more
instances with a load balancer the logic is prepared to handle more instances.
2.2.5. How to install
There are 3 ways how Reaction Engine can be used:- in standalone mode
- using a docker image with Tomcat 9 and Reaction Engine installed
- using WAR files to be deployed to an application server
- spring.datasource.XXX
- spring.mail.XXX
2.2.5.1. Standalone mode
It is the simplest way to make Reaction Engine work. All has to be done is
- to download the reaction-engine-standalone-1.1.zip file and unzip it
- to adjust the configuration file (conf\reaction-engine-application.yml)
- to set up the passwords in the security\credentials file
- to start the application with the script provided
Script is provided for Linux and for Windows. The script can start / stop the engine and the status can be queried.
reaction@acme334-vm1:/local/reaction/engine-standalone> ./reaction_engine.sh status
-----------------------------------
| Reaction Engine v1.1            |
-----------------------------------

Status                    : RUNNING
PID                       : 4131
PID file                  : /var/run/reaction-engine-daemon.pid
Location of log files     : /local/reaction/engine-standalone/logs
Application config file   : /local/reaction/engine-standalone/conf/reaction-engine-application.yml
Logging config file       : /local/reaction/engine-standalone/conf/logback-include.xml
The engine runs in an embedded Tomcat that can be configured in conf/reaction-engine-application.yml (see the bottom part of the file).
2.2.5.2. Docker container
Docker image is provided that contains the Reaction Engine deployed on Tomcat 9. More information in APPENDIX / Docker image
2.2.5.3. WAR files to be deployed
As I mentioned above the engine is tested on Tomcat 8, Wildfly 10 and Weblogic 12. Separate WAR files are provided to be deployed on the following application servers:
- reaction-engine-tomcat-1.1.war
- reaction-engine-weblogic-1.1.war
- reaction-engine-wildfly-1.1.war
The application server has to support servlet 3.0 specification (JSR 315). It needs JDK 8.
Before deploying the WAR file the following 3 system properties must exist in the the JVM of the application server:
- spring.profiles.active: basically it controls what scheduling implementation will be used in the application server (when an event is not started immediately but in a specific time;
e.g. the event is not in the maintenance window so it has to be scheduled).
The possible values are:
- commonjWorkmanager: if the engine is deployed to Weblogic then this value has to be chosen
- threadPool: for Tomcat
- wildfly: for Wildfly
sample value: -Dspring.profiles.active=commonjWorkmanager - spring.config.location: The locations of the config file
sample value: -Dspring.config.location=/local/reaction/reaction-engine/reaction-engine-application.yml - reaction.logback.config: The location of the logback configuration
file. The logging can be changed runtime by altering this file.
sample value: -Dreaction.logback.config=/local/reaction/reaction-engine/logback-include.xml
Weblogic
The system properties have to be added to the managed server where the engine has been deployed to.
- if using nodemanager: on the Admin Console add them to [managed server] -> Configuration -> Server Start -> Arguments
- if not using nodemanager: add them to JAVA_OPTIONS variables in the startManagedWebLogic.sh / startManagedWebLogic.cmd file
sample values: -Dspring.profiles.active=commonjWorkmanager
-Dspring.config.location=/local/reaction/reaction-engine/reaction-engine-application.yml
-Dreaction.logback.config=/local/reaction/reaction-engine/logback-include.xml
Wildfly
In Wildfly two things have to be configured:
- adding the system properties
please see here
The simplest solution is to set them when executing standalone.sh:bin\standalone.bat -Dspring.profiles.active=wildfly -Dspring.config.location=/local/reaction/management_app/reaction-engine-application.yml -Dreaction.logback.config=/local/reaction/management_app/logback-include.xml - configuring a scheduled executor service
In order to use scheduling in Reaction Engine a scheduled executor service has to be defined in Wildfly server.
For example: the following managed-scheduled-executor-service definition has to be added to standalone.xml file:<server xmlns="urn:jboss:domain:4.2"> ... <profile> ... <subsystem xmlns="urn:jboss:domain:ee:4.0"> ... <concurrent> ... <managed-scheduled-executor-services> ... <managed-scheduled-executor-service name="reaction-scheduled-executor-service" jndi-name="java:jboss/ee/concurrency/scheduler/reaction/scheduled-executor-service" context-service="default" thread-factory="default" hung-task-threshold="60000" long-running-tasks="false" core-threads="5" keepalive-time="5000" reject-policy="ABORT"/> </managed-scheduled-executor-services> </concurrent> ... </subsystem> ... </profile> ... </server>
Tomcat
Add the system properties to setenv.sh / setenv.bat.
For example: CATALINA_OPTS="-Dspring.profiles.active=threadPool
-Dspring.config.location=/local/reaction/reaction-engine/conf/reaction-engine-application.yml
-Dreaction.logback.config=/local/reaction/reaction-engine/conf/logback-include.xml"
Don't forget to add execute permission to setenv.sh if it is a new file.
The default URL for Weblogic and Wildfly is [host]:[port]/reaction-engine. In order to have the same URL for Tomcat I recommend to rename the WAR file to reaction-engine.war before deploying it.
2.2.5.4. Common configuration for each installation mode
The credentials file (the location of this file has to specified in reaction.security.credentials_file property of the engine config file) has to be set up correctly before deploying the application.
Sample content of the file:
localhost=f0dedb78-3eb6-4a56-8428-e8e40584a01c
reaction-management-web-app=e5574bf1-13c5-476a-b1d3-500bc640564d
2.2.6. Database
The database design and building details will be discussed in 2.3.3.
2.2.7. Configuration
The reaction engine has 2 files that can be configured:
- included logback config: the logging (logback) can be configured, it is defined with the reaction.logback.config system property
it is important to note that the logging can be configured runtime without redeploying the application or restarting the application server; the logback config is refreshed in every 30 sec - engine config file: the configuration file for the engine, it is defined with the spring.config.location system property
I enlist only those properties that should be changed. The description of the properties can be found here: https://docs.spring.io/spring-boot/docs/current/reference/html/common-application-properties.html
spring.datasource.url the JDBC URL of the database
sample value: jdbc:oracle:thin:@localhost:1521:xespring.datasource.username the name of the database user to connect to the database
sample value: reactionspring.datasource.password the password of the database user to connect to the database
sample value: reactionspring.jpa.database-platform the database platform that is currently used
the options are enlisted in https://docs.jboss.org/hibernate/orm/4.3/javadocs/org/hibernate/dialect/package-summary.html
sample value: org.hibernate.dialect.Oracle10gDialectspring.mail.host the host name of the mail server
sample value: smtp.gmail.comspring.mail.port the port of the mail server
sample value: 587spring.mail.username the name of the user that we want to connect to the mail server
leave it empty if no username is needed
sample value: reactiontesstspring.mail.password the password of the user that we want to connect to the mail server
leave it empty if no password is neededspring.mail.properties additional JavaMail session properties can be defined to connect to the mail server
the full list can be found here: https://javaee.github.io/javamail/docs/api/com/sun/mail/smtp/package-summary.html
for example the following 3 can be used for gmail (if you use a company mail server then you might not need these):
mail.smtp.auth: true
mail.smtp.starttls.enable: true
mail.transport.protocol: smtpreaction.management_web_app.endpoint the endpoint of the management web application
there is no communication from the engine to the web GUI, this endpoint is only used to put a valid URL to the mail that is sent
sample value: http://localhost/reaction-managementreaction.security.credentials_file the location of the credentials file that contains the usernames / passwords of all the workers that want to call the engine
- file can be used from classpath: classpath:security/credentials
- file with absolute path can be used: file:/local/reaction/engine/security/credentials
sample value: file:/local/reaction/engine/security/credentialsreaction.security.credentials_file_reload_period the credential file will be reloaded in every X sec specified here
sample value: 20reaction.security.nonce.delay the period that controls how long a request can be valid (in sec)
sample value: 900reaction.security.nonce.limit In order to prevent replay attacks a nonce value (UUID) is sent from the client (it is used to create the HMAC hash token and also in the HTTP header in clear-text format); on the server the last used nonce values are stored and checked if the nonce of the current HTTP request is already used
this setting controls how many nonce values will be kept
sample value: 10000reaction.security.encryption.transformation the name of the transformation
for more info please see: https://docs.oracle.com/javase/7/docs/technotes/guides/security/StandardNames.html#Cipher
sample value: AESreaction.security.encryption.keystore.location the location of the keystore where the private key of the Reaction Engine is to decrypt the message
sample value: c:/work/reaction/src/reaction/_security/serverkeystore.jckreaction.security.encryption.keystore.password the password of the keystore reaction.security.encryption.keystore.type the type of the keystore
sample value: JCEKSreaction.security.encryption.keystore.key_alias the alias in the keystore that points to the certificate reaction.security.encryption.truststore.location the location of the truststore where all the public keys of the workers are which want to encrypt the message with certificates
i.e. it can happen that the truststore is not needed if all the workers use symmetric encryption
WARNING! The aliases of worker certificates must be the host name of the worker (that is defined in conf/worker.yml -> host_name, see 2.1.6.)! So when you import a worker certificate to this truststore then first have a look what its hostname is and use this text as an alias.
sample value: c:/work/reaction/src/reaction/_security/servertruststore.jckreaction.security.encryption.truststore.password the password of the truststore reaction.security.encryption.truststore.type the type of the truststore
sample value: JCEKSreaction.mail.enabled.error_when_executing_task_on_host sending a mail about an error that occured when the executor worker executed an OS command on a host
sample value: truereaction.mail.enabled.error_unknown sending a mail when unkown error occurs
sample value: truereaction.mail.enabled.when_starting_a_flow sending a mail when a flow is started
sample value: truereaction.mail.enabled.when_confirmation_is_needed sending a mail when starting a flow has to be confirmed by the user
sample value: truereaction.mail.enabled.error_while_running_the_flow sending a mail about any error that occured while the execution flow was running (except the ones handled at 'error_when_executing_task_on_host')
sample value: truereaction.mail.template_folder External template folder which can contain the mail templates
if this is not empty then all the templates have to reside in the folder; when the application starts it will check if the templates are in the specified folder
if it is empty then the internal mail templates will be used
2.2.8. Status
If the Reaction Engine is started then the status can be checked by opening the http://[host]:[port]/reaction-engine/status URL (e.g. http://localhost:7003/reaction-engine/status).
If the engine runs then it will display HTML page that can confirm that.
2.3. Management web GUI
2.3.1. What does it do?
The web GUI provides the following functions:
- providing a dashboard to check the important metrics
- managing the reference data (system, execution flow, error detector)
- monitoring the running, finished, failed, etc. execution flows
- scheduling an execution flow
- manually starting an execution flow
- displaying statistics
- user management
2.3.2. How to install?
The web GUI is a Python-Django web application which is recommended to use with Apache.
An installation package is provided for Ubuntu and CentOS (Red Hat) that contains the installation files of the management web application and the installation script: reaction_management_app_installation_v1_2.bsx
The installation package is tested on Ubuntu 16.04, Ubuntu 18.10, CentOS7 and Red Hat 7.
All has to be done is to execute the installation package which will extract the installation files and it will help to install all the dependencies of the management web application and configure it properly.
Please see below a sample how it starts:
reaction@3e51e0c6858e:/$ /local/reaction/generate_self_contained_executable/build/reaction_management_app_installation_v1_2.bsx

...extracting the installation files of Reaction management app and the installation utility will start soon...

---------------------------------------------------------------------------------------------------------------
| It might be worth to make a note of the following info...                                                   |
| If the installation utility wasn't finised successfully and it has to be called later then please execute   |
| (and not executing the reaction_management_app_installation_v1_2.bsx multiple times):                       |
|       /tmp/reaction_ma_1540314016556/install-reaction-management-app_v1_2.sh                                |
| If the installation utility asks where the installation files are then please use the following path:       |
|       /tmp/reaction_ma_1540314016556                                                                        |
---------------------------------------------------------------------------------------------------------------
> Press enter to continue!


---------------------------------------------------------------------------------------
-          Welcome to the installation utility of Reaction Management App!            -
---------------------------------------------------------------------------------------

Do you use CentOS (Red Hat Linux) or Ubuntu? [c/u]
> u
Which Ubuntu version do you use (16.04 or 18.10)? [6/8]
> 6

Installing unzip...
[sudo] password for reaction:
Reading package lists... Done
Building dependency tree
Reading state information... Done
unzip is already the newest version (6.0-20ubuntu1).
0 upgraded, 0 newly installed, 0 to remove and 35 not upgraded.


------------------------------------------------------------- Reaction management app installation
/\/\/\/\/\/\/\/\/\/\/\/\/\/\/\/\/\/\/\/\/\/\/\/\/\/\/\/\/\/\/\/\/\/\/\/\/\/\/\/\/\/\/\/\/\/\/\/\/\
^^^^^^^^^^^^^^^^^^^^^^^^^^^^^^^^^^^^^^^^^^^^^^^^^^^^^^^^^^^^^^^^^^^^^^^^^^^^^^^^^^^^^^^^^^^^^^^^^^
Is python3.6 already installed (with development package and pip)? [Y/n]
> n

I am going to install python 3.6 with development package and pip.
  ** The following commands will be executed: sudo apt-get install -y software-properties-common python-software-properties && sudo add-apt-repository ppa:jonathonf/python-3.6 && sudo apt-get update -y && sudo apt-get install -y python3.6 python3.6-venv python3.6-dev
> Press enter to continue!
Reading package lists... Done
Building dependency tree
...
During the installation the following tasks can be performed:
- installing python3, creating a virtual environment and installing django dependencies
- installing Apache2 with mod_wsgi
- installing database client install (mysql / Oracle)
- setting up management app (configuring Apache, altering the config file of management app, creating the database schema, creating management app superuser)
Generally the following steps have to be done to install the management web GUI in Windows:
- install Apache
- install python3 (recommended to create a virtual environment)
- install Django and the required dependencies (first activate the virtual environment if created)
- install database client
- install mod_wsgi to Apache
- copy the source of management app to the host of Apache
- configure the web GUI
- initialise the database (create tables and load the initial data)
- create superuser to be able log in to the user management and create the users in the user management
2.3.3. Database
There are 2 ways of creating the database:
- executing SQL file
- using Django's migration commands
2.3.3.1. Executing the SQL file
Separate SQL files are provided to create the tables for Oracle and mariaDB. The script creates only the table structure and insert the vital data so it won't create database/schema, database users, etc.
If other database has to be supported, please open an issue on https://bitbucket.org/ric_flair_wcw/reaction/issues. Please be aware that the Django migration supports many different database types!
2.3.3.2. Using Django's migration commands
The Python-Django mighration commands can be used to create / alter the database schema. The reason of that is that Django can handle many different database types so it is not needed to provide different SQL scripts per database type. Also Django can handle any change in the database schema without needing to recreate the whole database
The installation package helps to create the database schema too.
In the following I provide steps how to create the database tables.
For mysql please create the database with latin1 character set. If you need other character set than latin1 (e.g. utf8mb4) then the length of the CharField fields in the management_app/.../models.py files mustn't be higher then 191 (otherwise getting the Specified key was too long; max key length is 767 bytes error.)! Another workaround (aside from decreasing the length of Charfield fields) is to set the innodb_large_prefix to true. And the 3rd workaround is to raise a ticket on https://bitbucket.org/ric_flair_wcw/reaction/issues
- create a user in the database and set the settings (the DATABASES variable in settings_reaction.properties config file)
- go to [APP_ROOT]/management-app
for example:cd /local/reaction/management-app - make migrations
before doing so the virtual environment has to be activated (e.g. source /local/reaction/environments/venv/bin/activate) and execute the following command in the management_app folderpython manage.py makemigrations admin_system admin_execution_flow admin_errordetector monitoring scheduler common worker_status
(only for Oracle: before making the migrations I had to set the LD_LIBRARY system variable to the Oracle client like: export LD_LIBRARY_PATH=/usr/lib/oracle/12.2/client64/lib:$LD_LIBRARY_PATH) - migrate the changes to the database
execute the following command in the management_app folderpython manage.py migrate - execute reaction.sql
It is important not to remove the 'migrations' folder that is created during the migration! If the database needs to be changed then these migrations will be used only to apply the changes to the database.
2.3.4. Modules
The management web GUI has the following parts:
- Dashboard
- Administration
- system
- execution flow
- error detector
- Monitoring
- Scheduler
- Executor
- Approval
- Statistics
- Worker status
- User management
There are common characteristics of the web pages like
- on forms there are marks next to the labels
- question mark: help is provided how to fill the field
- exclamation mark: warning message about the field
- star: the field is mandatory
- the lists can be filtered by the textfields being put above the columns
the values are checked if they are in the specific field and 'AND' operation is applied if more values are specified
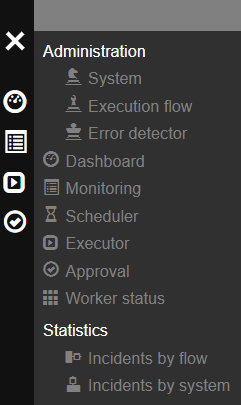
On the left side the most used icons can be found (Dashboard, Monitoring, Executor, Approval). The full menu can be displayed by clicking on the left top icon.
2.3.4.1. Log in
Before using the application the user has to log in with his / her credentials (user name and password). If the user forgets the password then he / she can reset the password by clicking on the Lost password? link.
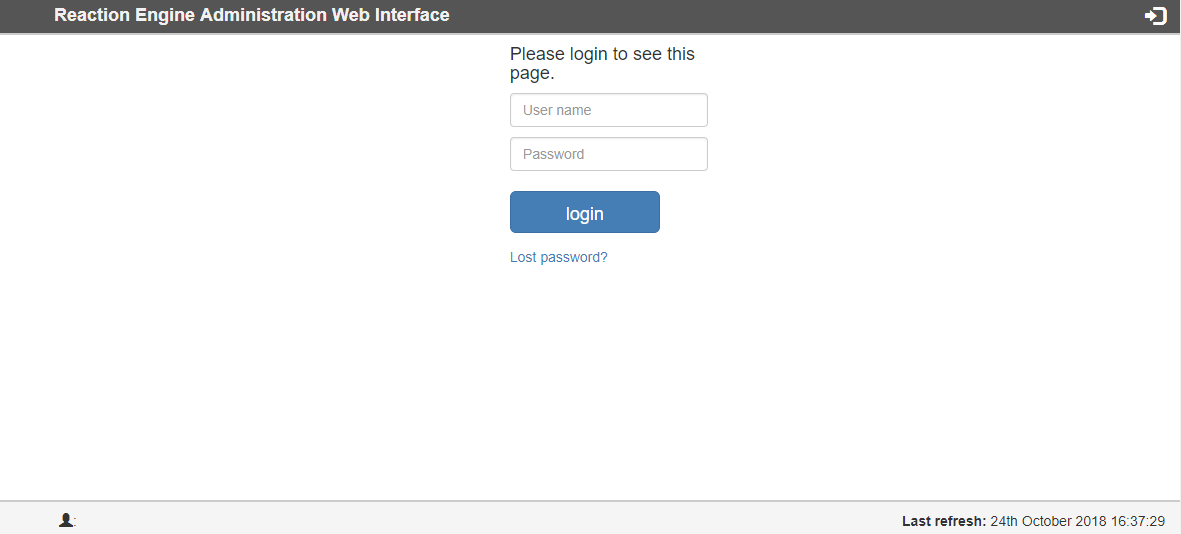
The user is redirected to this page if the session expired. After the successful login he / she will be forwarded to the same page where they were before.
2.3.4.2. Dashboard
The dashboard page can provide important metrics and information about the events (running / failed / etc. flows) in the engine.
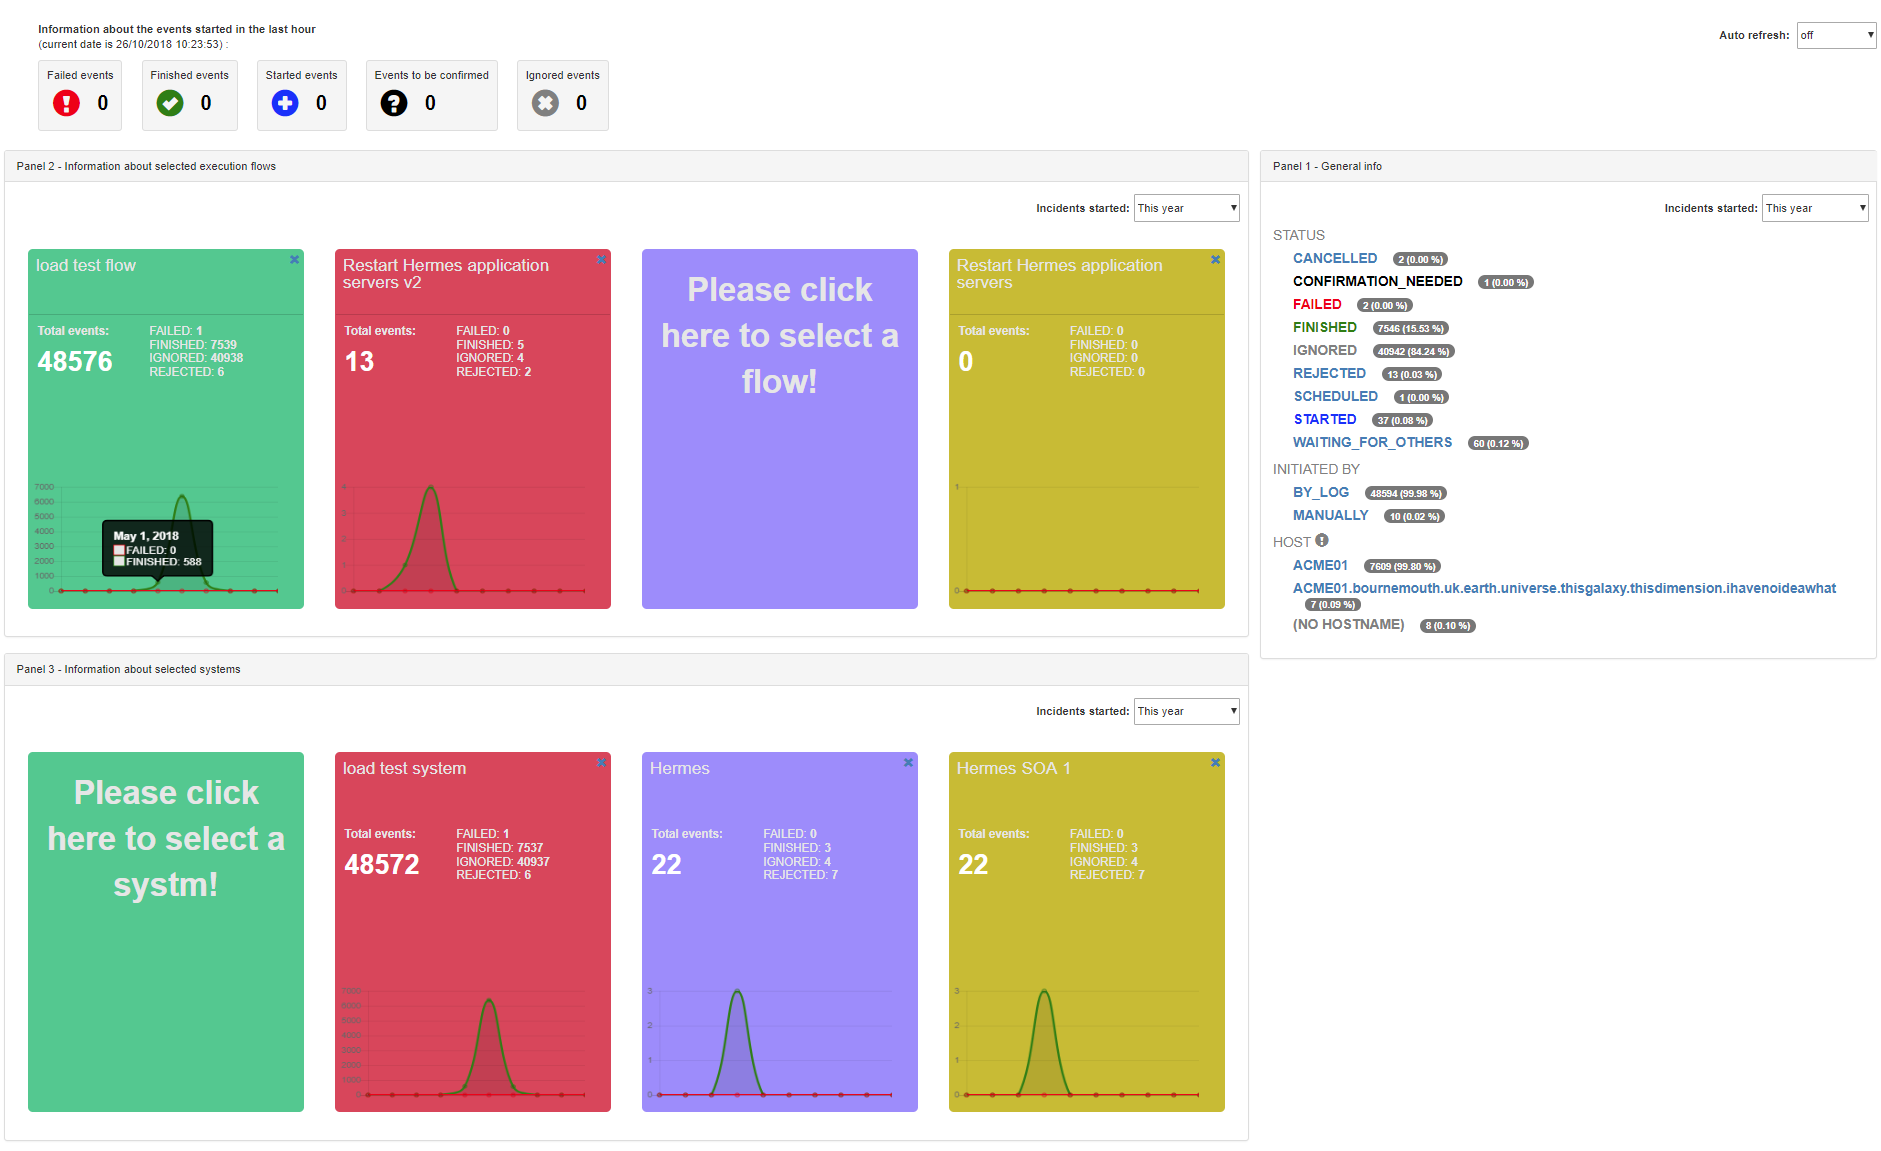
With the drop-down list on the top-right corner the auto refresh periods can be controlled.
The top line shows the failed, finished, started, to be confirmed and ignored events that occured in the last one hour.
Panel 1 (right side) displays the events grouped by the status, by the initiator (by log, manually, etc.) and by the host where the events occured.
Panel 2 and panel 3 show the events from the execution flow's (panel 2) or the system's (panel 3) perspective. 4 (or less) flows or systems can be selected to be viewed and these selections will be saved in the user's profile.
2.3.4.3. Monitoring
The events (started, failed, finished, etc. execution flows) can be monitored here.
List
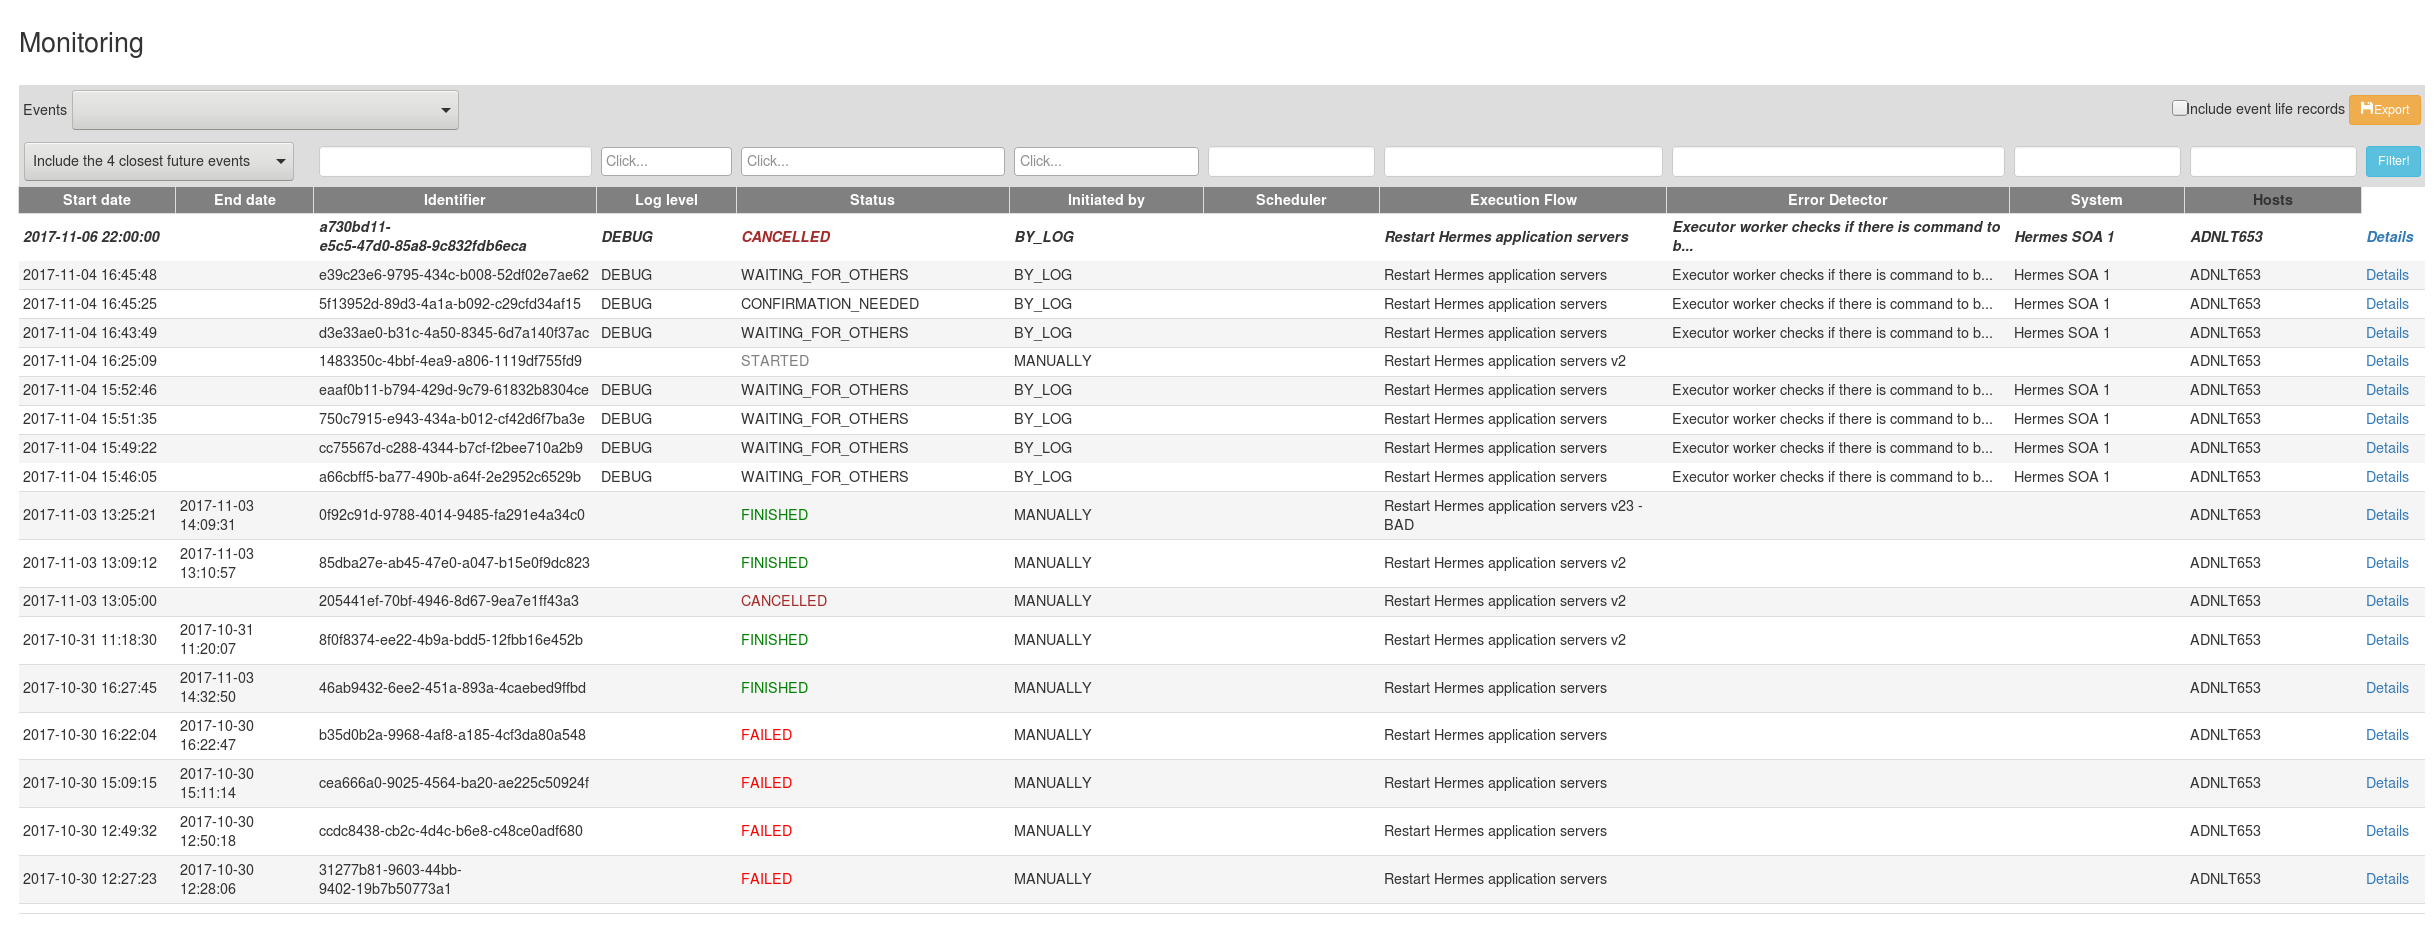
The drop-down list (next to the label Event) is for filtering the events by the start date. The labels are self-explanatory, when choosing the Started between a date from and to can be defined for the filtering.
Below this drop-down list there is another one which is for defining if the future (scheduled) events should be displayed.
By clicking on the Export button the events can be exported to a CSV file. It can be set if the CSV file contains the event life (which are basically the statuses of the tasks of the execution flow) records.
At the end of every line there is a Details link which navigates the user to the Details page.
The scheduled events (starting in the future) are displayed on the top of the list with bold and italic letters.
Details
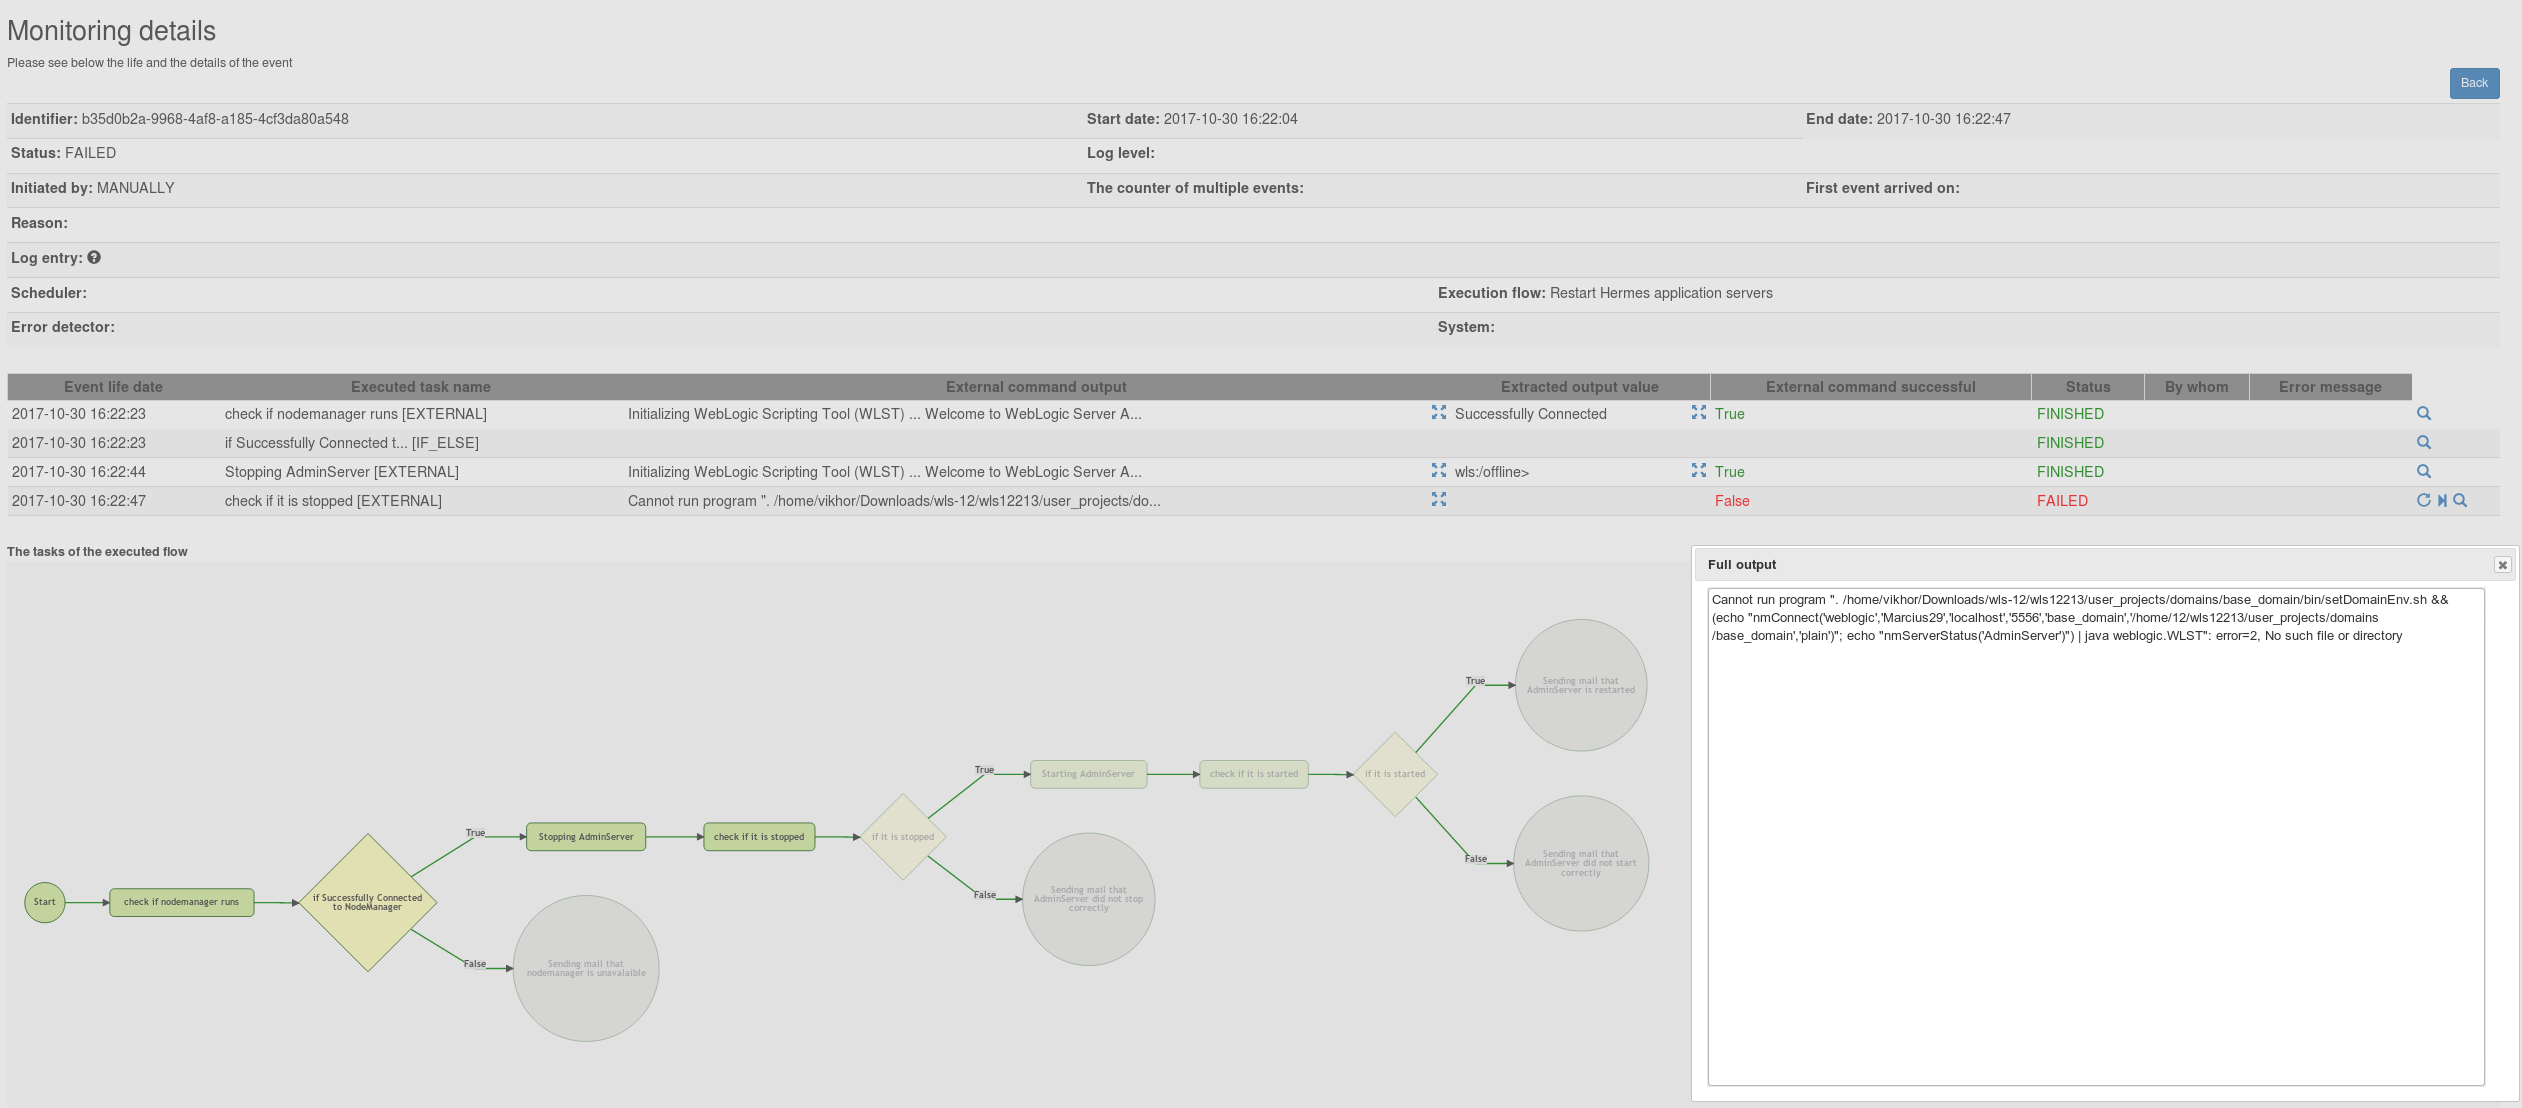
On top the header information of the event can be found. The panel can be collapsed by clicking on the plus and it is stored on client side if it is collapsed or not.
Auto refresh can be turned on, the page will be refreshed in every 6 seconds so the progress of the flow can be followed.
In the middle the event life records are (also the panel can be collapsed and it is stored if it is collapsed or not.). Here the ouput of of the external command can be displayed (by clicking on the Show the full output button) or the extracted value (by clicking on the Show the full extracted value) which might be used in the next if-else condition.
At the end of the line of the event life records the following icons might be seen:
- Restart the failed task: it is displayed for a failed task only; the failed task can be executed again (e.g. some manual work has to be done on the host before executing it again)
- Skip the failed task: it is displayed for a failed task
only; the failed task can be skipped (e.g. the problem is fixed manually
on the host so the execution can continue with the next task)
if the next task is an if-else condition then a value has to be provided by the user! - View the history of the event life: every event life record has a history and the dates can be checked by clicking on the link (e.g. when an external command started, when it was executed by the executor worker on the specific host, when the execution finished, etc.)
In the bottom the execution flow is displayed, those tasks are pale that weren't executed (due to the evaluation of the if-else conditions or the execution is not there yet)
2.3.4.4. Administration - system
List
In the system list page the existing systems can be viewed.
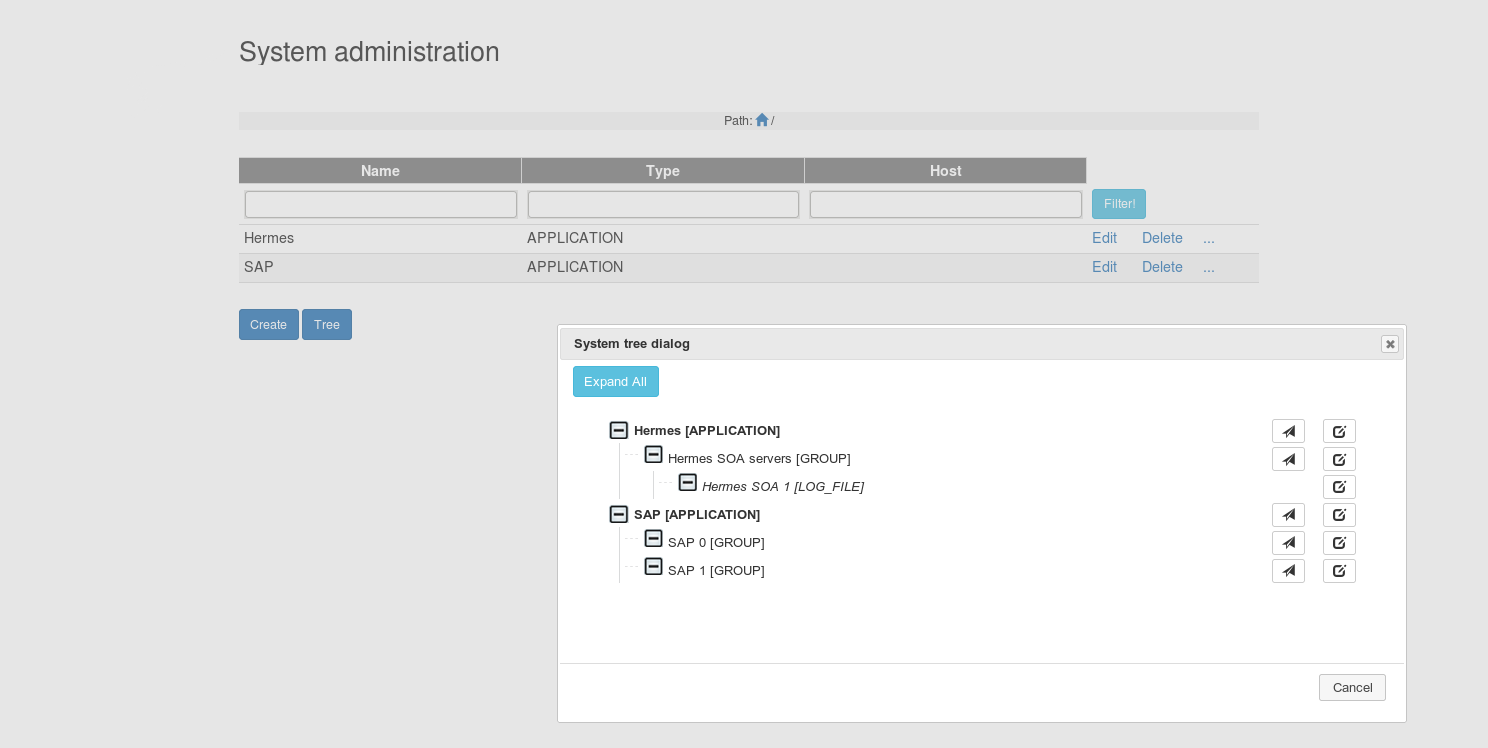
Hierarchy of systems can be built so not all the systems can be seen
here but those which are on the highest level (or depending on whichever
level we are on).
Above the list (in the middle) the current path of the system is displayed and it can be used to navigate.
Also a tree list is provided where all the systems are displayed in a tree. At the end of every system line there is a Jump to the children link which can be used to jump the children list of the system. If the system's type is group or application then the Jump to the children of the system link will appear next to it. By clicking on the Edit the system button the edit page can be jumped to.
Edit
An existing system can be edited or a new one can be created.
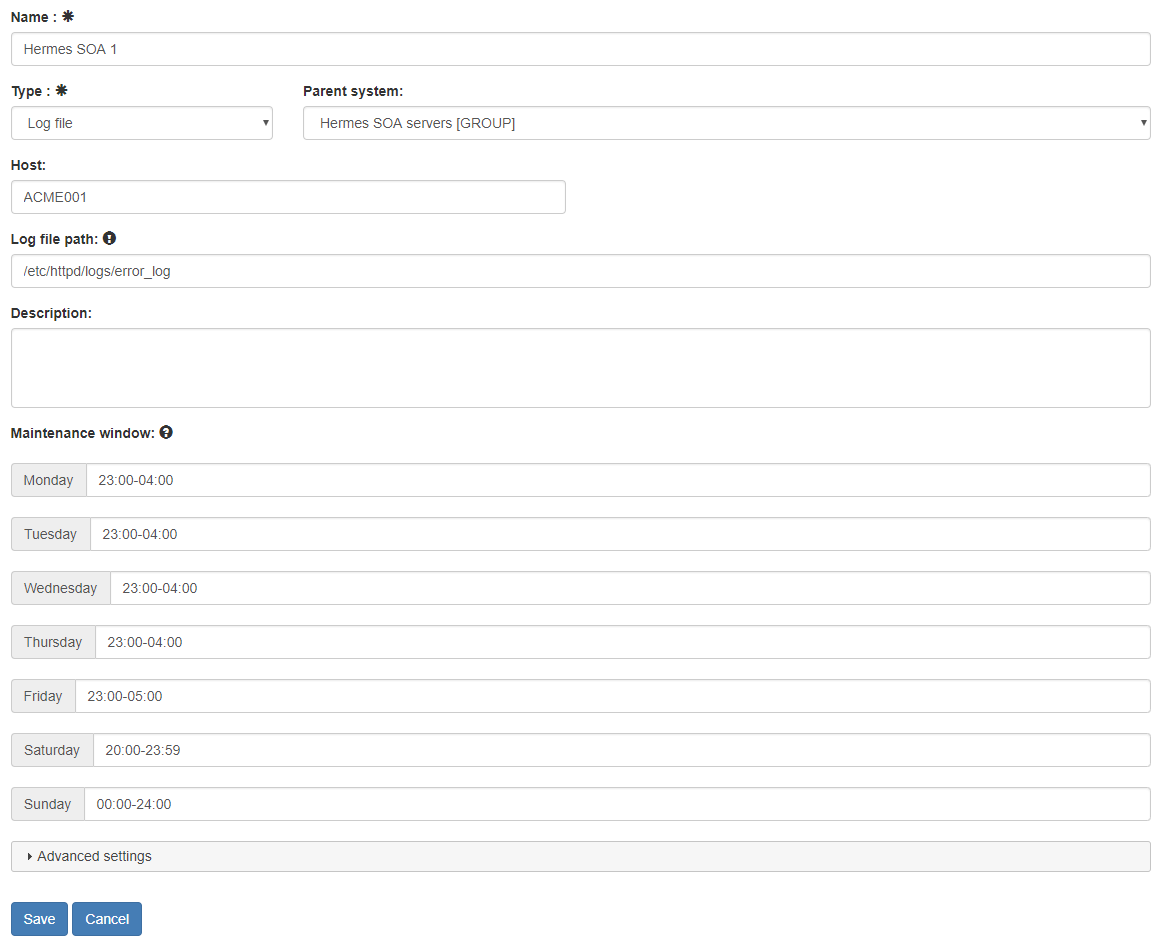
The name and the type properties are mandatory to specify.
If the current system's type is Log file then the following properties have to be specified on the current system or on
one of its parents:
- host
- log file path
- log header pattern
If the log header pattern is disabled then the log header pattern doesn't have to and cannot be specified. In this case the log level of the system doesn't have to be specified either as it won't be used.
If the log header pattern is enabled then the log header pattern
- either has to be filled if it is not set on any of the parents of this system
- or doesn't have to be set (just leave the log header pattern enabled checkbox on) if it is already specified on any of the parents of this system (however it can still be specified which will overwrite the value of the parent). In this case the log level of the system must present on this system or on one of its parents. - log level
See the rules at log header pattern
Warning! The log header is usually set in that case if log level has to be checked before sending a possible incident to the engine (e.g. a log text is interesting if it is logged on WARN or ERROR level i.e. if the same text is written to the log file on DEBUG level then it won't be taken into account).
The log header pattern can be built by clicking on the Build button (if the log doesn't contain a header then you don't have to specified the log header pattern).
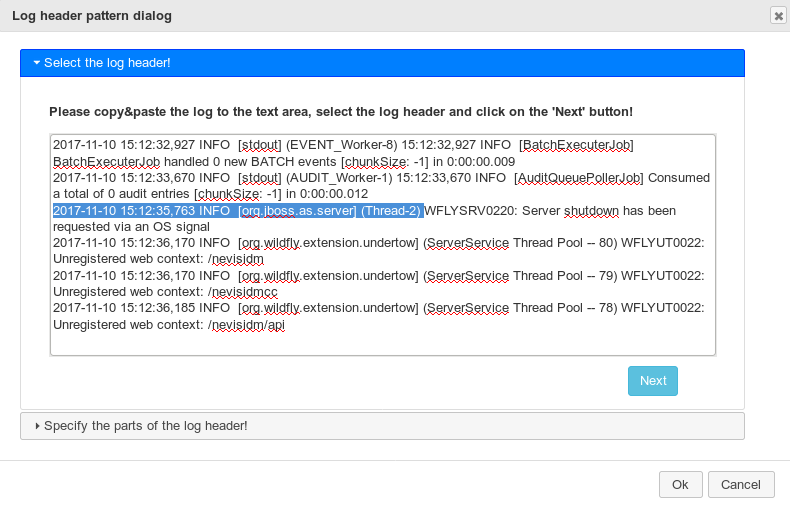
First copy a part the log that contains the log header (it can have
more lines) and click the end of the header in the text. The header will
be highlighted (selected) automatically from the beginning of the line.
Please click on the Next button.
On the next page the selected text can be seen on top and the pattern can be defined by clicking on the
- DATE - if the log header contains the timestamp then here you can define it
by hovering over the question mark next to the Date pattern label help will be displayed about the date-time format
More information : https://docs.oracle.com/javase/8/docs/api/java/text/SimpleDateFormat.html - LOGLEVEL - it is a mandatory field, you can show where the log level is in the header
- UNKNOWN - any field in the log header can be specified that can change
also a pattern has to be defined what characters can be in that value (for example if the value can have only numbers then add 0-9, if it can contain letters, number and space then please write a-zA-Z 0-9)
buttons. First please select the text with the mouse where the date / loglevel / unknown value is then click on the specific button. The text will be replaced with that patter field.
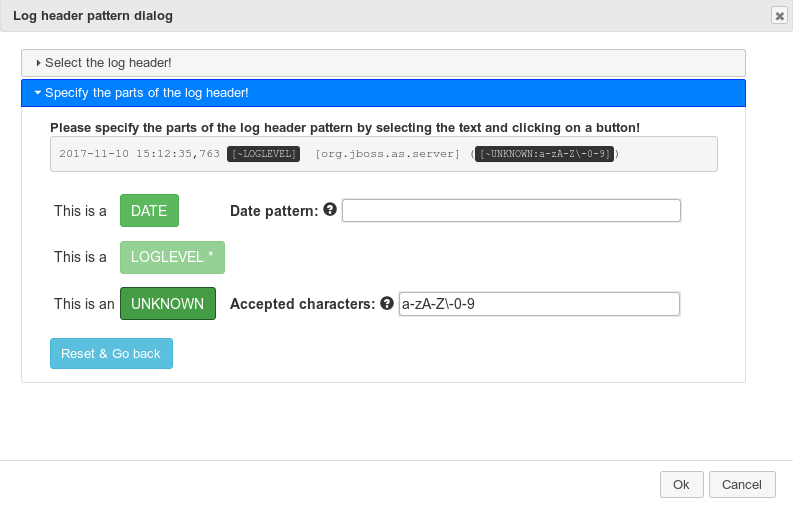
For example: you selected the following text from the log as header
2017-11-24 08:49:24,166 [DEBUG] root:
First type the date format in the textfield next to the Date pattern label (for example: yyyy-MM-dd HH:mm:ss,SSS), then select the text 2017-11-24 08:49:24,166 on top and click on the DATE button. The text will be replaced with [~DATE:yyyy-MM-dd HH:mm:ss,SSS] [DEBUG] root: and the pattern text will be highlighted.
Then select the text DEBUG and click on the LOGLEVEL button.
In the end and type a-zA-Z 0-9 (however the text is root so the pattern a-z
would be enough but you have to be careful here as the field may
contain other value too that contains number, space, etc. Please examine
the log file before adding the pattern text!), in the 'accepted characters' textfield (next to the button UNKNOWN), select the text root on top and click on the UNKNOWN button. The end result will be
[~DATE:yyyy-MM-dd HH:mm:ss,SSS] [[~LOGLEVEL]] [~UNKNOWN:a-zA-Z 0-9]:
Note: if you not sure that one or more space can be between fields (e.g. [DEBUG] root: there is one space between the text '[DEBUG]' and 'root:' now but can it be more?) then please select that one space and defined it as UNKNOWN field with a ' ' pattern. It means that field can have 1 or more space.
The created pattern can be checked if it can be used to extract the values from a real log entry.
You have to define a real log entry (like 2017-11-24 08:49:24,166 [DEBUG] root: get_queryset - admin_system.views| filter :{'parent': '2'}, order: ['name', 'id']) and by clicking on the Check button the extracted values will be displayed if the pattern is good (the output will be here: The following values were found: DATE: 2017-11-24T08:49:24.166 LOG LEVEL: DEBUG UNKNOWN: root).
2.3.4.5. Administration - execution flow
List
In the execution flow list page the existing execution flows can be viewed.
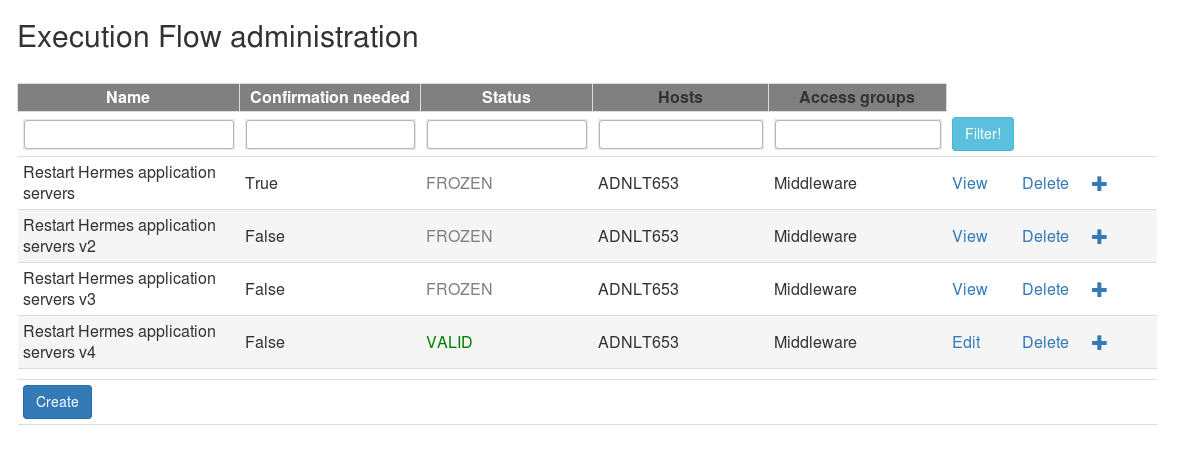
By clicking the Copy the execution flow button (which is not displayed for invalid flows) the flow can be copied with all its tasks. Whit this function it is easy to create a new version of an existing flow.
Edit
An existing execution flow can be edited or a new one can be created.
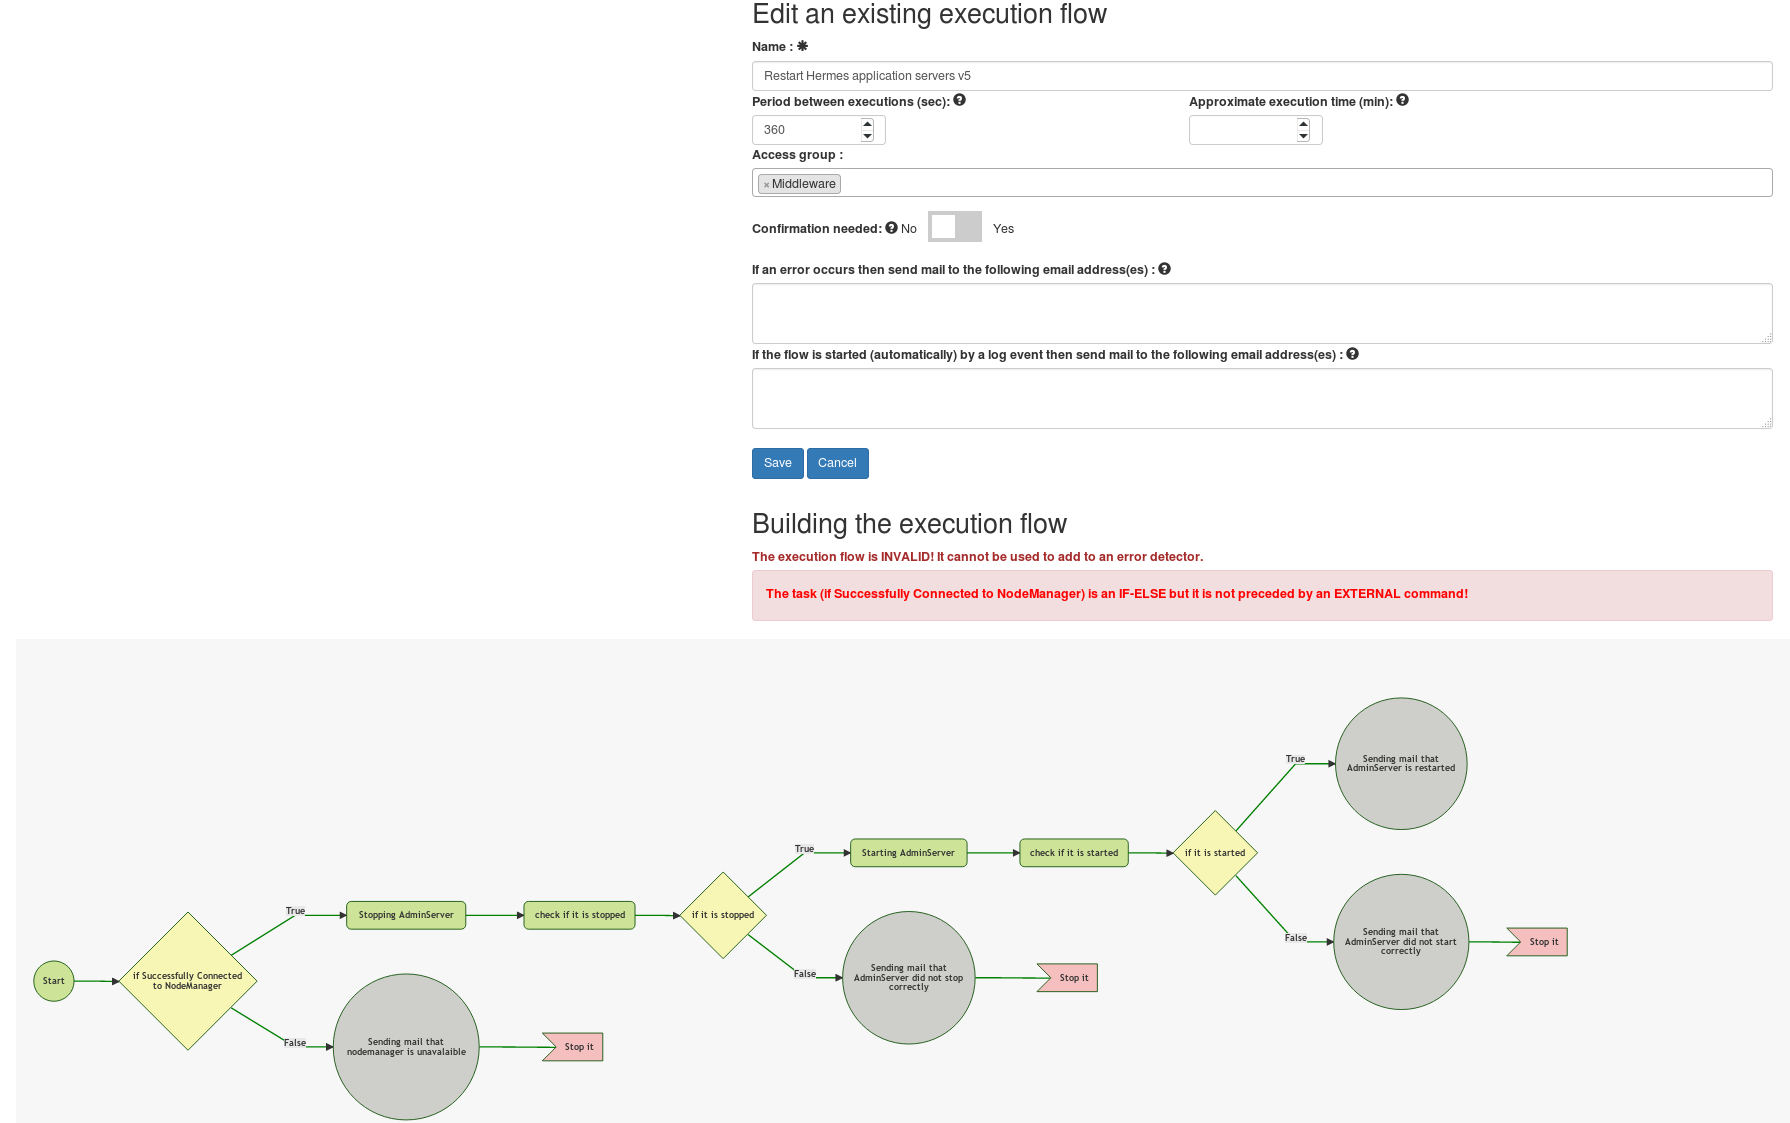
On the top part of the page the fields of the execution flow can be edited / added (see at the reference data / execution flow).
At the bottom the execution flow can be edited / created. It
basically means that new tasks can be added to the flow, an existing one
can be altered or deleted.
It is important to note when creating a new flow the flow has to be saved first before adding any task to it.
If the execution flow was in use already then it has history (i.e.
events saved that can be monitored) so it cannot be edited (otherwise
the history couldn't be reviewed correctly in the monitoring page - i.e.
if a task is deleted then the new flow will contain less tasks). In
this case the execution flow is in read-only mode (FROZEN status).
However a new version of this can be made by clicking on the Copy button in the List view. If this history is not needed and the current flow has to be modified then by clicking on the Unfreeze it by deleting its history -> the full history of this flow will be deleted and the flow can be edited again (please be careful with this operation). If lots of events belong to the execution flow then it would be better to clean-up the history with SQL commands.
There is one rule that will apply for the flow: before every if-else condition an external task command has to be executed if the condition of the if-else contains the $COMMAND_OUTPUT variable which represents the output of the previously executed external command (to get the value to be evaluated by the if-else). If this rule breaks then the flow becomes invalid (INVALID status) and it cannot be copied and it cannot be used in an error detector.
When creating a new flow only the Start task can be seen. It is just the beginning point of the flow it doesn't do anything. When clicking on the Start
button then a window will appear when the data of a new external task
can be added and it will be inserted after the Start (i.e. it will be
the first task).
All the other operations on the flow (like add a new task, etc.)
can be performed by clicking on an existing task. The window that will
appear looks like as follows:
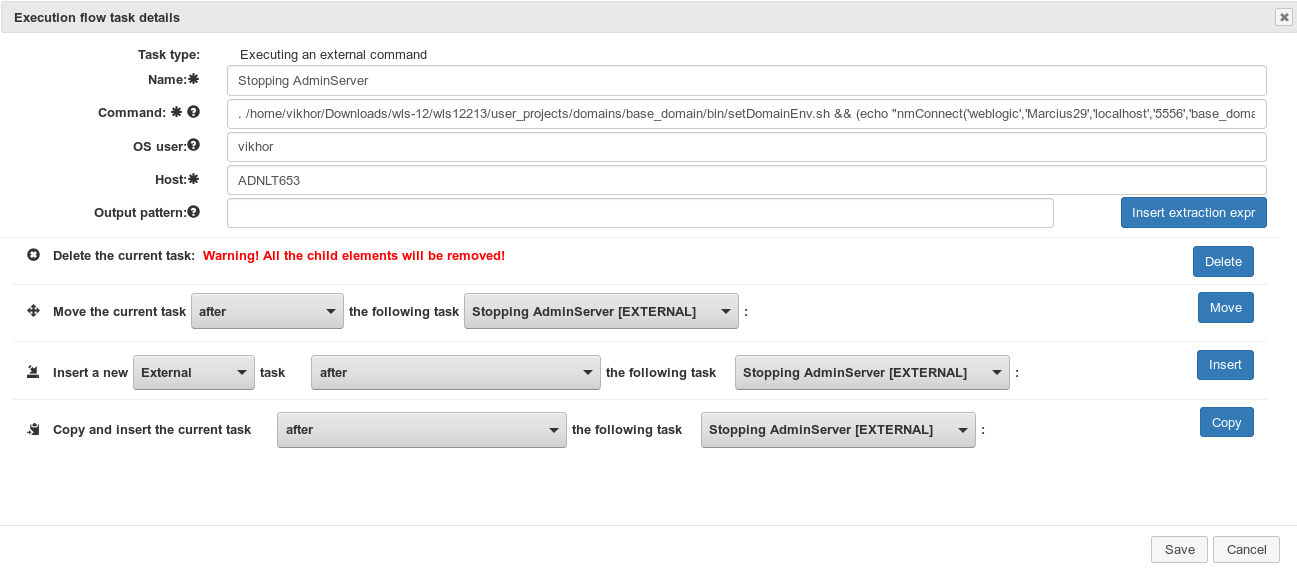
The top part of the window contains the data of the task that varies depending on the task type (see reference data / execution flow task).
In the bottom part operations can be done with a task:
- delete the current task - Warning, all the subtasks will be removed of an if-else condition!
- move the current task - The current task can be moved in the flow by selecting another task which the current one will be moved after. If the to TRUE branch of or the to FALSE branch of option is selected then the current task will be moved to be the 1st task on the true or false branch of the if-else condition.
- insert a new task - Insert a new task by selecting its type and place. If the to the beginning of the TRUE branch of or the to the beginning of the FALSE branch of
option is selected then the current task will be moved to be the 1st
task on the true or false branch of the if-else condition.
After clicking on the Insert button a new window is displayed to fill the data of the chosen task.
If the type is if-else condition then you can choose- with empty TRUE and FALSE branches - it means that 1-1 dummy external task will be put to the 2 branches
- and add the subsequent existing tasks to the TRUE/FALSE branch
for example there are 2 external commands A and B that are executed sequentially; later it turns out that B has to be executed only if a condition is fulfilled so insert an if-else condition after A with the and add the subsequent existing tasks to the TRUE branch option
- copy and insert the current task - copy the current task after a specific task. This option cannot be used for if-else condition.
2.3.4.6. Administration - error detector
List
On the list page the existing error detectors can be viewed.

Edit
An existing error detector can be edited or a new one can be created.
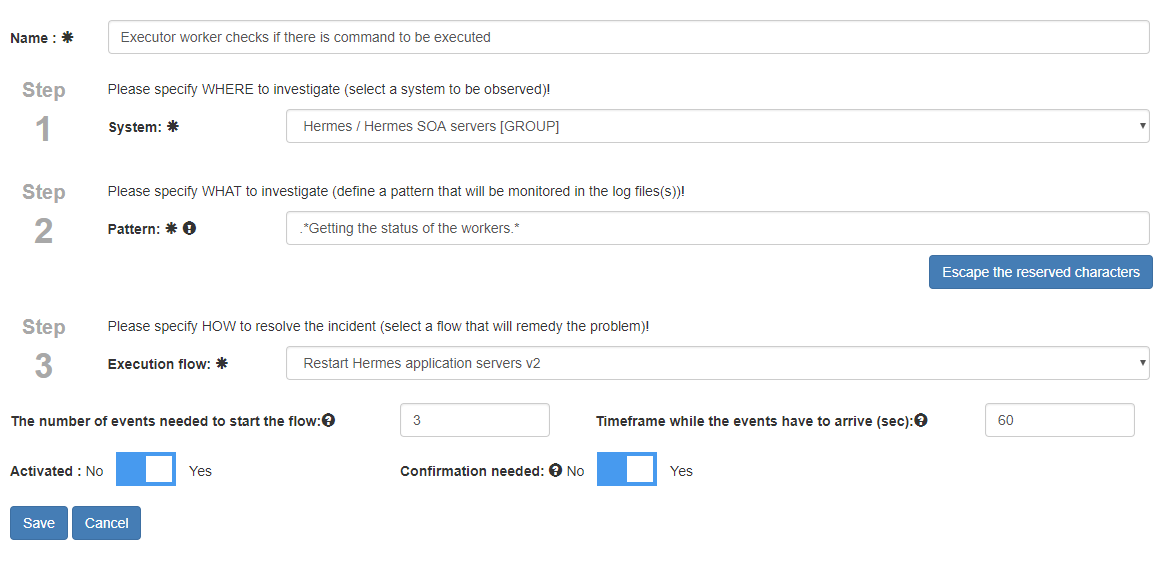
2.3.4.7. Scheduler
List
The scheduled execution flows can be viewed on this page.

First the scheduled execution flow (which is basically an execution
flow and a crontab expression) has to be created but by default it won't
be scheduled. It can be scheduled by clicking on Schedule it! button.
If
the currently running instance of the scheduled flow ran successfully
then it will rescheduled based on the crontab expression. If it didn't
run successfully then the scheduled task will be descheduled (i.e. won't
be rescheduled). It can be scheduled again by clicking on the button
again.
The started instance of the scheduled execution flow can be monitored on the Monitoring page by filtering on the Scheduler column.
Edit
An existing scheduled execution flow can be edited or a new one can be created.
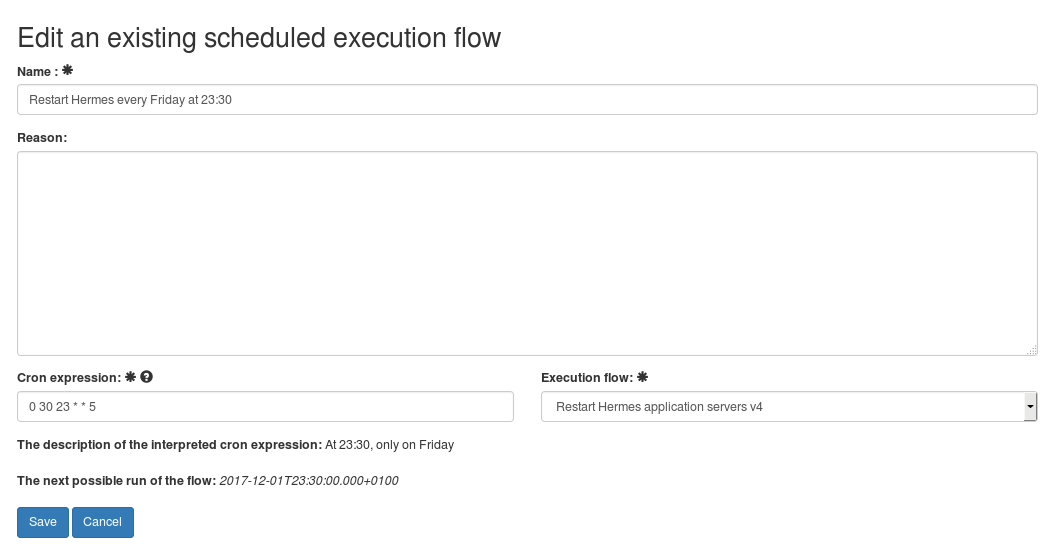
The crontab expression has a text description after being saved and the next possible run is displayed too. The next run date is calculated in the Reaction Engine (i.e. it is a REST call to it) so if the Engine doesn't run then an error message can be seen here (like Warning! The server cannot be called! 503(Service Unavailable) "The server on localhost:8080 is down!")
2.3.4.8. Executor
An execution flow can be started immediately (select the Now option) or at a specific time in the future (select the on the following date option and choose a datetime).
A reason can be added (not mandatory) to explain why it was needed.
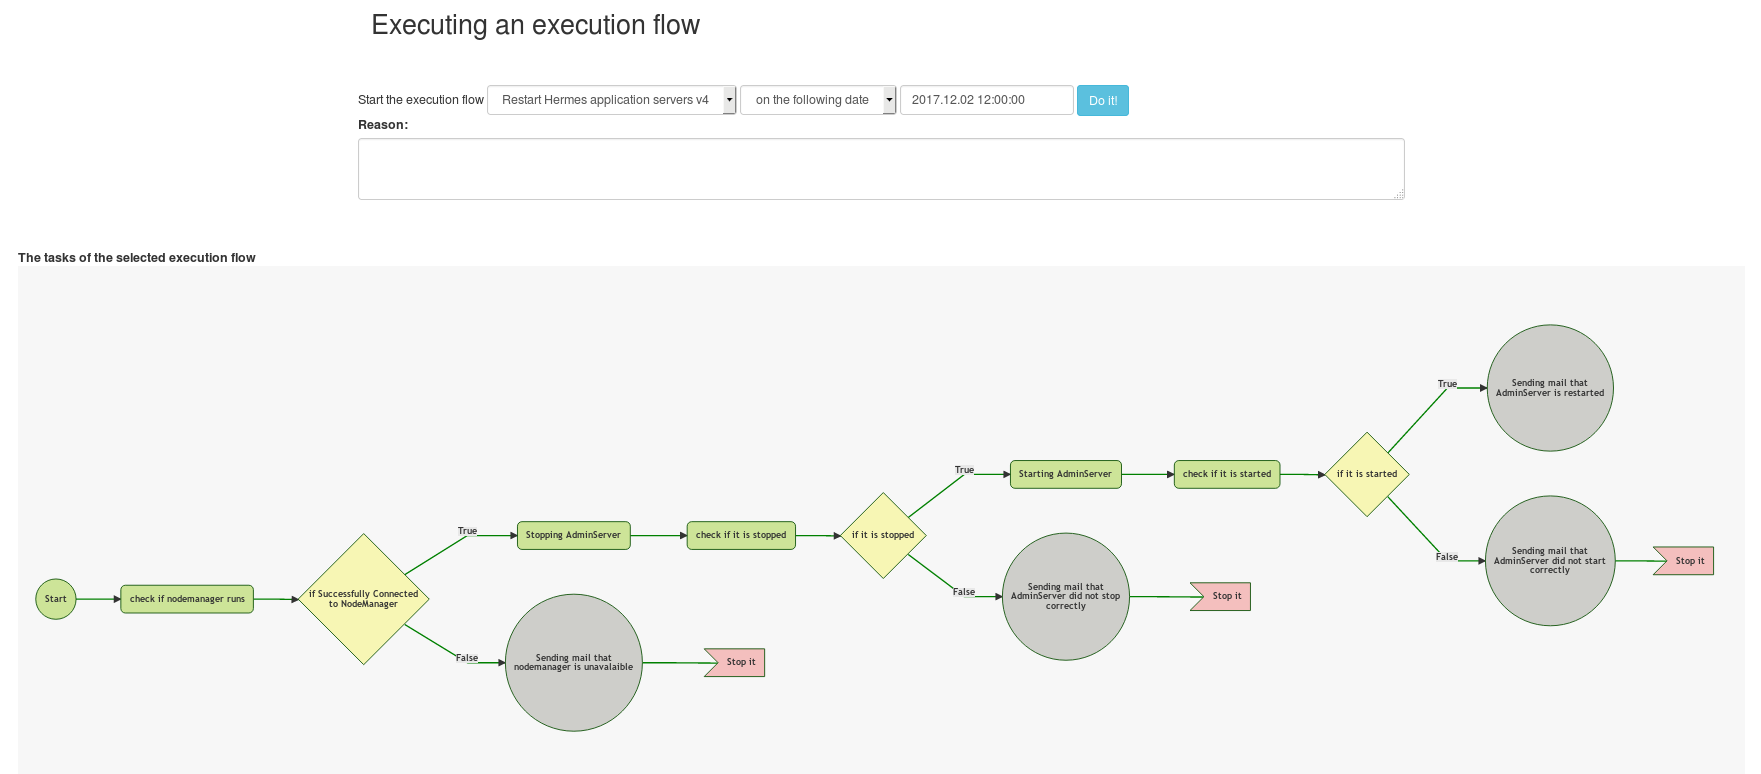
We'll have immediate feedback about the start and in case of the successful start the identifier of the started flow will be displayed (it is a link).
2.3.4.9. Approval
List
The list of execution flows are enlisted here that have to be manually approved (by the user) before they will be started (when defining an error detector it can be set if the flow has to be manually approved before starting it).
Approval
The flow can be approved or rejected by filtering an event on the list view and clicking on the Details link.
The top part of the page contains the main data of the event.
At the bottom the flow can be seen.
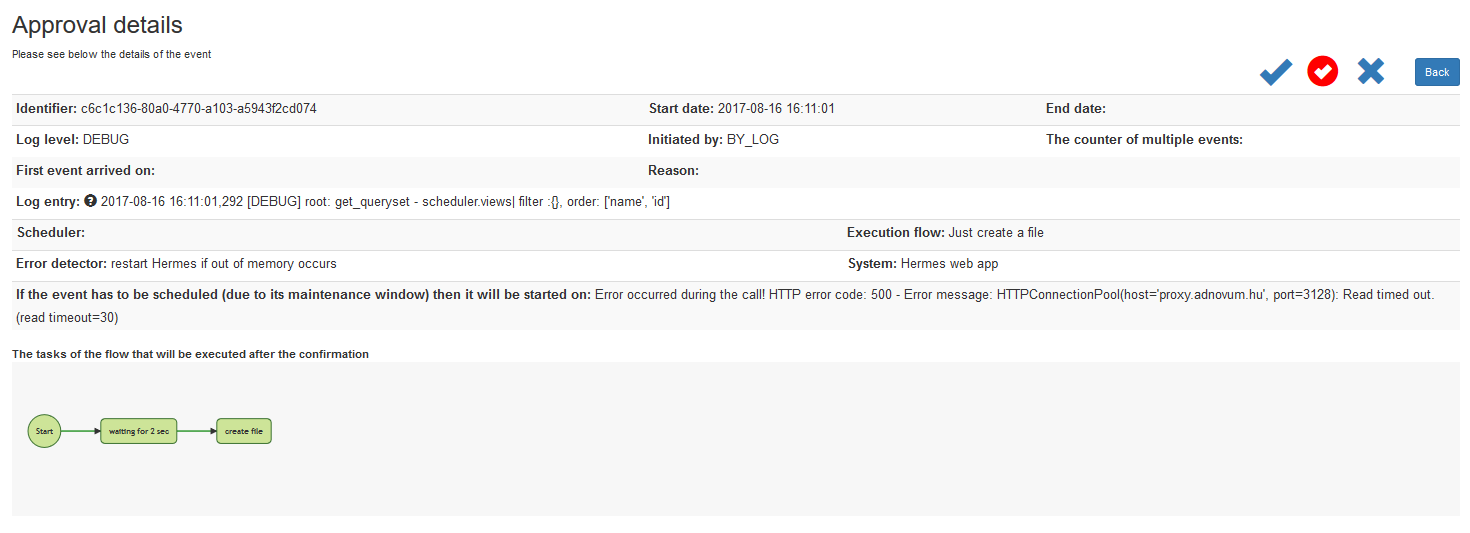
There are 4 buttons on the top right corner:
- Approve it! : approving the flow and
- start it if it is in the maintenance window (i.e. the maintenance window open on Saturday between 08:00 and 20:00 and now it's Saturday 12:20) or no window is defined
- schedule it if it is NOT in the maintenance window
- Approve and force start it! : approving the flow and starting it immediately (the maintenance window will be ignored)
- Reject it. : rejecting to start it
- Back
Please be aware that the flow will be rescheduled to next available timeslot if it doesn't fit in the current one with the execution time of the flow (e.g. an event arrives at 02:40, the maintenance window is open between 01:00 and 03:00 so theoretically the flow can be executed but the execution time of the flow is 30 min so it won't finish by 03:00).
2.3.4.10. Statistics
Incidents by flow
Statistics can be collected by a flow.
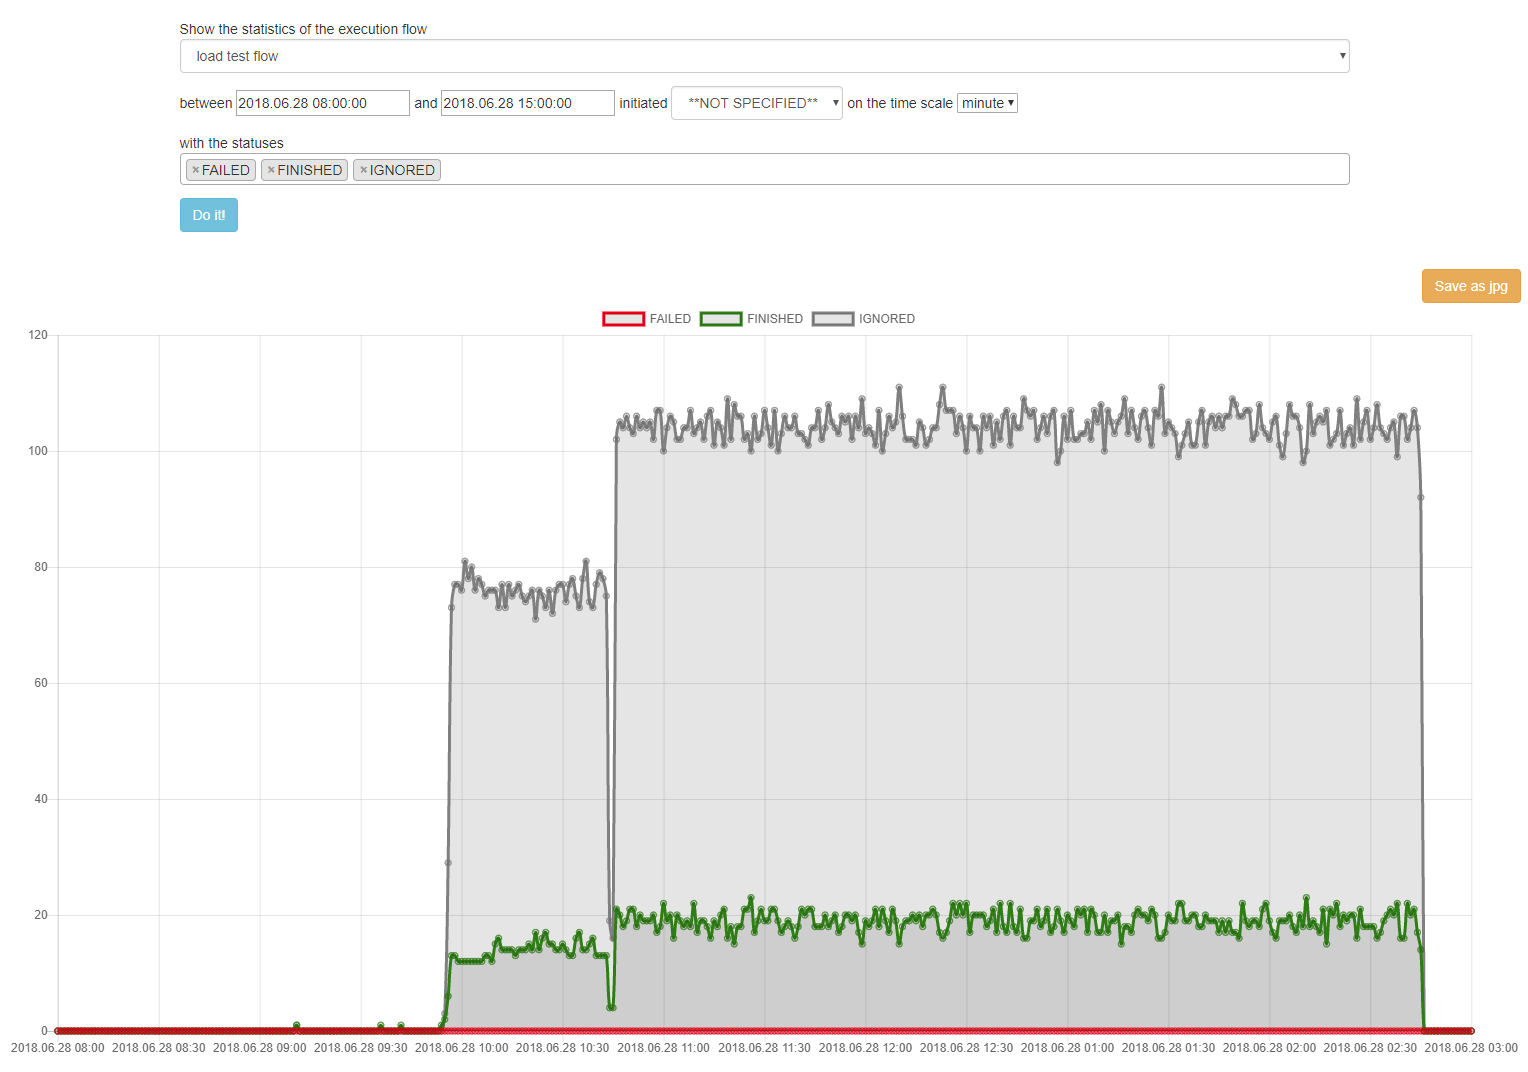
You can review how many events
- of a specific execution flow were
- in operation (started, scheduled, ignored, etc.)
- in a timeframe (the start date of the event is between 2 dates)
- that were initiated manually, by the log file (an incident was reported by the reader worker) or by the scheduler
The timeframe can be minute, hour, day or month. The events will be summarised by minute, hour, day or month and will be displayed.
Incidents by system
Statistics can be collected by a system.
2.3.4.11. Worker status
Whenever a reader worker refreshes its system list, reports an incident or an executor worker gets the commands to be executed, sends back the output/result of the executed command the Engine will store the timestamp of this last happening.

On this page all the workers can be seen that has ever communicated
with the Engine and it can be checked when it happened. Possible errors
with the workers can be found.
The reader's activity is considered
too old (i.e. likely it stopped on the host machine or not able to
communicated -> highlighted in red) if it got the system list 24
hours ago last. Similarly the executor is too old if no new REST call
was sent to get the commands to be executed in the last 2 hours.
2.3.4.12. User management
The users of the web management GUI can be administered on the following link: http://[host]:[port]/[context root]/admin (for example: http://localhost/reaction-management/admin/ if a web server is used on the port 80).
It
is important to note that this application is part of the Django
framework and not the Reaction application. Some minor changes are
possible but no big alteration can be done.
The users can be added to groups (not detailed).
Permissions can be added and removed. It is important to make sure that the following permissions have to exist (these permissions were inserted during 2.3.3. Database - step 5):
- Can use Monitoring - the monitoring page is visible in the menu and the user can open it
- Can use System administration - the system administration page is visible in the menu and the user can open it
- Can use Execution Flow administration - the execution Flow administration page is visible in the menu and the user can open it
- Can use Errordetector administration - the errordetector administration page is visible in the menu and the user can open it
- Can use Scheduler - the scheduler page is visible in the menu and the user can open it
- Can use Executor - the executor page is visible in the menu and the user can open it
- Can use Approval - the approval page is visible in the menu and the user can open it
- Can use Statistics - the statistics page is visible in the menu and the user can open it
- Can use Worker status - the worker status page is visible in the menu and the user can open it
If the database was initialised properly then this page doesn't have to be used.
On the users page the users can be maintained. If a new user has to be created then click on the Add User
button on the top right corner. To edit an existing user just click on
his/her name. In order to delete one or more users first select it in
the table, select the Delete selected users option and click on the Go button.
On the user detail page the following fields have to be filled:
- username
- first / last name
- email address - the Engine will send notifications (e.g. a flow has to be approved, error occurred while executing the flow, etc.) to this email address
- permissions - please assign permissions (see above) to the user
e.g. if a user should be able to approve flows only (no administration, etc.) then assign only the Can use Approval permission - access groups - the user can be added to one or more access groups
and he/she will see only those execution flows (and the events that
belong to the flows) on the management web GUI that have the access
groups
for example: Mary is in the DBA access group and the access group of flow1 is Middleware and DBA, flow2's group is UNIX so Mary can have access to the flow1 on the web GUI but not to the flow2
Only those access groups can be used that are defined in the config file of the management app (see in 2.3.5. -> ACCESS_GROUPS)! If more than one group is specified then the group names have to be separated by comma (for example: DBA, Middleware). The order of the groups is not important.
Make sure the user is active and the management web GUI's users shouldn't be staff user or superuser.
2.3.5. Config file
The configuration file resides in the management_app folder.
There are 2 configuration files:
- settings.py: shouldn't be changed (however it can be if needed!), it contains general settings
- settings_reaction.py: the settings of the management application, the settings are explained below
| LOGGING |
Specifying the logging configuration handlers/file - the configuration of the file log handler handlers/console - the configuration of the console log handler loggers/root - specifying which handler is active and what the default log level is |
| DEBUG | A boolean that turns on/off debug mode. Never deploy the management app into production with DEBUG turned on. One of the main features of debug mode is the display of detailed error pages. Possible values: False / True |
| ALLOWED_HOSTS | A list of strings representing the host/domain names that this Django site can serve. This is a security measure to prevent HTTP Host header attacks, which are possible even under many seemingly-safe web server configurations. More info: https://docs.djangoproject.com/en/1.11/ref/settings/#allowed-hosts |
| DATABASES |
Specifying the database connection details or |
| EMAIL_HOST | Mail server host. More info: here |
| EMAIL_HOST_USER | Username to use for the SMTP server defined in EMAIL_HOST. If it is empty, Django won't attempt authentication. More info: here |
| EMAIL_HOST_PASSWORD | Password to use for the SMTP server defined in EMAIL_HOST. This setting is used in conjunction with EMAIL_HOST_USER when authenticating to the SMTP server. If either of these settings is empty, Django won't attempt authentication. More info: here |
| EMAIL_PORT | Port to use for the SMTP server defined in EMAIL_HOST. More info: here |
| EMAIL_USE_TLS | Whether to use a TLS (secure) connection when talking to the SMTP server. More info: here |
| REACTION_ENGINE_REST_URL | The endpoint URL of the Reaction Engine Sample value: http://10.20.213.149:7003/reaction-engine |
| ACCESS_GROUPS | All the access groups have to be specified which control which users (depending on the
access groups assigned to it) can see what execution flow (depending on the access groups assigned to it) on the Monitoring page or on the
Execution flow administration page. Here all the access groups have to be enlisted that might be used. WARNING! The name of the group MUSTN'T contain comma (,) and don't use space in front of or at the end of the group name! It is recommended to use only letters, numbers and space in the name. Sample value: ACCESS_GROUPS = [ 'Middleware', 'DBA', 'UNIX', 'Microsoft Technologies', ] |
| TIME_ZONE | A string representing the time zone for datetimes stored in this database. Sample value: TIME_ZONE = 'Europe/London' |
| REACTION_REST_AUTH_PUBLIC_KEY REACTION_REST_AUTH_PRIVATE_KEY |
Public/private key (username/password) for authenticating the
request that is sent to the Reaction Engine REST. The same username /
password pair has to be in the credentials file of Reaction Engine (see
2.2.7 -> reaction.security.credentials_file). Sample value: REACTION_REST_AUTH_PUBLIC_KEY = 'reaction-management-web-app' REACTION_REST_AUTH_PRIVATE_KEY = 'e5574bf1-13c5-476a-b1d3-500bc640564d' |
APPENDIX
1. Creating certificates
If encryption between the worker and the engine is needed then there are 2 options:
- CREDENTIAL_BASED: symmetric encryption - using the the user/password that is used for HMAC authentication
- CERTIFICATE_BASED: asymmetric encryption i.e. public and private keys are used to encrypt the REST call
Here I will describe how to create self-signed certificates for the server and the workers.
Creating the server's public / private key to serverkeystore.jck
Execute the following command:
keytool -genkeypair -alias server -keyalg RSA -keysize 1024 -storetype jceks -validity 730 -keypass password -keystore serverkeystore.jck -storepass passwordThe output is:
What is your first and last name?
  [Unknown]:  Reaction Engine
What is the name of your organizational unit?
  [Unknown]:  Unknown
What is the name of your organization?
  [Unknown]:  Reaction
What is the name of your City or Locality?
  [Unknown]:  Bournemouth
What is the name of your State or Province?
  [Unknown]:
What is the two-letter country code for this unit?
  [Unknown]:  UK
Is CN=Reaction Engine, OU=Unknown, O=Reaction, L=Bournemouth, ST=Unknown, C=UK correct?
  [no]:  yes
creating the ACME00 worker's (client) public / private key to client_ACME00_keystore.jck
Separate certificates have to be created for every worker. It is important the the alias name ('ACME00' in this sample) has to be the same as the host name (it is not necessarily the real host name of the machine) of the worker defined in the worker.yml configuration file!
Execute the following command:
keytool -genkeypair -alias ACME00 -keyalg RSA -keysize 1024 -storetype jceks -validity 730 -keypass password -keystore client_ACME00_keystore.jck -storepass passwordThe output is:
What is your first and last name?
  [Unknown]:  Reaction Worker ACME00
What is the name of your organizational unit?
  [Unknown]:
What is the name of your organization?
  [Unknown]:  Reaction
What is the name of your City or Locality?
  [Unknown]:  Bournemouth
What is the name of your State or Province?
  [Unknown]:
What is the two-letter country code for this unit?
  [Unknown]:  UK
Is CN=Reaction Worker ACME00, OU=Unknown, O=Reaction, L=Bournemouth, ST=Unknown, C=UK correct?
  [no]:  yes
Exporting the public key of ACME00 worker (client) from client_ACME00_keystore.jck to .crt file
All the workers' public keys have to be exported.
Execute the following command:
keytool -export -alias ACME00 -storetype jceks -keystore client_ACME00_keystore.jck -storepass password -file client_ACME00.crtThe output is:
Certificate stored in file client_ACME00.crtExporting the public key of server from serverkeystore.jck to .crt file
Execute the following command:
keytool -export -alias server -storetype jceks -keystore serverkeystore.jck -storepass password -file server.crtThe output is:
Certificate stored in file server.crtImporting the server's public key to the client's (ACME00 worker) truststore
Execute the following command:
keytool -importcert -alias server -file server.crt -keystore client_ACME00_truststore.jck -keypass password -storepass passwordThe output is:
Owner: CN=Reaction Engine, OU=Unknown, O=Reaction, L=Bournemouth, ST=Unknown, C=UK
Issuer: CN=Reaction Engine, OU=Unknown, O=Reaction, L=Bournemouth, ST=Unknown, C=UK
Serial number: 731601f6
Valid from: Wed Dec 06 20:57:38 CET 2017 until: Fri Dec 06 20:57:38 CET 2019
Certificate fingerprints:
         MD5:  42:A7:B1:AB:C5:C5:15:EE:25:69:17:74:43:AC:31:A7
         SHA1: FA:FF:71:38:1E:17:AE:58:55:7C:1E:D8:B2:53:CE:69:CA:CF:53:45
         SHA256:
0F:2B:EF:2D:21:14:B9:F1:FC:38:4F:83:5D:E7:8F:DB:93:4D:08:17:BC:AB:B2:2A:1F:69:B0:12:6F:CB:38:A0
         Signature algorithm name: SHA256withRSA
         Version: 3

Extensions:

#1: ObjectId: 2.5.29.14 Criticality=false
SubjectKeyIdentifier [
KeyIdentifier [
0000: 45 51 88 74 ED 62 F1 2B   05 8E E7 6B 21 6F 11 5F  EQ.t.b.+...k!o._
0010: 70 93 9D 84                                        p...
]
]

Trust this certificate? [no]:  yes
Certificate was added to keystore
Importing the client's (ACME00 worker) public key to the server's truststore
The server's truststore must contain all the public keys of those workers where certificate based encryption should be used.
Execute the following command:
keytool -importcert -alias ACME00 -file client_ACME00.crt -keystore servertruststore.jck -keypass password -storepass passwordThe output is:
Owner: CN=Reaction Worker ACME00, OU=Unknown, O=Reaction, L=Bournemouth, ST=Unknown, C=UK
Issuer: CN=Reaction Worker ACME00, OU=Unknown, O=Reaction, L=Bournemouth, ST=Unknown, C=UK
Serial number: 12f6894
Valid from: Wed Dec 06 21:04:05 CET 2017 until: Fri Dec 06 21:04:05 CET 2019
Certificate fingerprints:
         MD5:  B1:7B:78:B9:80:86:3B:26:EA:73:E1:82:7A:4A:81:DD
         SHA1: F8:C5:6C:A5:36:D2:39:DD:39:67:E5:1C:E5:A2:AC:3F:4F:6A:D7:7C
         SHA256:
5D:3A:60:84:D6:B0:CD:E6:88:2B:85:D6:2B:F0:67:12:1E:55:26:B8:0B:30:6B:67:81:A0:67:14:19:A8:9E:3D
         Signature algorithm name: SHA256withRSA
         Version: 3

Extensions:

#1: ObjectId: 2.5.29.14 Criticality=false
SubjectKeyIdentifier [
KeyIdentifier [
0000: BE 5C 65 FD 46 40 9D 34   C9 F5 D4 59 BC F0 32 94  .\e.F@.4...Y..2.
0010: 3C F0 77 AC                                        <.w.
]
]

Trust this certificate? [no]:  yes
Certificate was added to keystore
final result
After these commands the following files should exist in the folder:
- client_ACME00.crt
- client_ACME00_keystore.jck
- client_ACME00_truststore.jck
- server.crt
- serverkeystore.jck
- servertruststore.jck
2. Database access configuration of management web GUI
Mysql / Mariadb
Setting up database details in the settings-reaction.py config fileDATABASES = {
'default': {
'NAME': 'reactionstore',
'ENGINE': 'django.db.backends.mysql',
'USER': 'reaction',
'PASSWORD': 'reaction',
'HOST': 'localhost',
'PORT': '3306',
'OPTIONS': {
'autocommit': False,
},
}
}Please add the following lines to the beginning of the settings_reaction.py file
import pymysql
pymysql.install_as_MySQLdb()
Oracle
Setting up database details in the settings-reaction.py config fileDATABASES = {
'default': {
'NAME': 'reactionstore',
'ENGINE': 'django.db.backends.oracle',
'USER': 'reaction',
'PASSWORD': 'reaction',
'HOST': 'localhost',
'PORT': '1521',
}
}The client can be download from: http://www.oracle.com/technetwork/database/features/instant-client/index.html
The Basic Light package is enough if only English language is needed.
Installation instructions: http://www.oracle.com/technetwork/database/features/instant-client/index.html
Please be aware, if the local python installation is 32 bit then during the installation of the python Oracle package will install a 32bit cx_oracle so the Oracle Client has to be 32bit too! (Even if the machine/windows is 64 bit.)
To find out if the python is 32 or 64 bit is please execute the following commands in the python shell (make sure the virtual env is activated and just type python in Linux command shell):
import struct
print(struct.calcsize("P") * 8)
3. Docker image
For engine
The Docker image of the engine (based on Ubuntu 18.10) can be pulled with the following command:
docker pull reactionengine/engine:1.1The Tomcat server starts when the docker images runs which can be done with the following command:
docker run -d reactionengine/engine:1.1The config file (see below) of the engine contains default values so they have to be changed first. The bash terminal of the running container can be started with
docker exec -it [container ID] bashWhen the modification is finished the docker container has to be stopped and started, for example:
docker stop [container ID]Other important important information about the image:
| Linux root user: | root/root |
| The engine's log file location: | /local/reaction/engine/log/reaction-engine.log |
| The engine's config files location: | /local/reaction/engine |
| Tomcat log file location: | /opt/tomcat/logs/catalina.out |
For management app
The Docker image of the management application (based on Ubuntu 18.10) can be pulled with the following command:
docker pull reactionengine/management_app:1.1The Apach2 server starts when the docker images runs which can be done with the following command:
docker run -d reactionengine/management_app:1.1The config file (see below) of the management contains default values so they have to be changed first. The bash terminal of the running container can be started with
docker exec -it [container ID] bashWhen the modification is finished the docker container has to be stopped and started, for example:
docker stop [container ID]The docker image contains JDBC drivers for mysql and Oracle too.
Other important important information about the image:
| Linux root user: | root/root |
| Management app config file: | /local/reaction/management_app/management_app/settings_reaction.py |
| Apache2 log file location: | /var/log/apache2 |
| Management app log file location: | /local/reaction/management_app_log/ |
| The administrator user's name and password: | admin / reactionengine |
| The admin URL where new users can be created: | http://<container IP>/reaction-management/admin |
For demo
In order to demonstrate the capabilities of Reaction Engine a Docker image (based on Ubuntu 18.10) is provided. The image can be pulled with the following commands:
docker pull reactionengine/demo:1.1The image can be started with the following command:
docker run -u reaction -it reactionengine/demo:1.1 /bin/bashSimilarly if proxy has to be set then use the following:
docker run -u reaction -e http_proxy=http://proxy.acme:3128 -e https_proxy=http://proxy.acme:3128 -it reactionengine/demo:1.1 /bin/bashAfter starting the image with the command above the Linux user reaction will be logged in. A script is created to start all the Reaction services, just execute it when logged in with user reaction:
/local/reaction/start_reaction_services.shLinux users and passwords:
root / root
reaction / reaction
Use Reaction in Docker image
The endpoint URLs to be used are as follows:- management app web GUI: http://<container IP>/reaction-management
- user management of the management app web GUI: http://<container IP>/reaction-management/admin
- status page of Reaction Engine: http://<container IP>:8080/reaction-engine/status
To find out the IP address of the container please execute:
docker inspect -f '{{range .NetworkSettings.Networks}}{{.IPAddress}}{{end}}' <container ID or name>User to log in to the management app web GUI: vikhor / reactionengine
User to log in to the user management of the management app web GUI: admin / reactionengine
The worker resides in /local/reaction/worker, the management app can be found in /local/reaction/management_app and the configuration files of the Reaction Engine are in /local/reaction/reaction-engine.
The home directory of Tomcat 8 is /opt/tomcat, the deployed Engine is in the webapps folder.
Use the installed flow(s)
The Reaction demo already contains 2 execution flows (they can be examined after logging in to the management GUI).
One of them (Hermes restart if out of memory error occurs) is the one that is used in the videos in the presentation (please see it here).
It contains the data of a successful execution too (click on Monitoring
and set the Events filter to empty). The flow cannot be executed
successfully as no Weblogic servers are installed.
The flow restarts Weblogic managed servers on two different hosts. It
also contains an IGNORED flow execution to demonstrate that the same
flow is not started if an existing one is already running.
The other one (Record current time) is a sample flow that creates a folder if it doesn't exist yet and record the current time to afternoon.txt file if it's in the afternoon and to the morning.txt file otherwise.
The flow can be executed by the Executor or by the Scheduler.
The automatic incident resolving can be tried out too: in order to do that a
log file entry is already created as a system (please see in Administration / System / local Reaction Management App log) and an error detector is bound the execution flow with the system (Recording when the user clicked on the worker status in management app).
The log file points to the log file of the Reaction management web app itself. The
error detector checks if the following pattern occurs in the log file: .+Getting the status of the workers.+GET.+.
You'll get similar texts in the log file if you click on the Worker
status menu in the management app GUI i.e. any time when you open the
Worker Status page then the flow will be started.
First the flow has to be approved (please set the mail settings of the Engine
if mail has to be sent) as it is set in the error detector. After the
approval the flow might be scheduled (if not selecting the 'approve and
force to start' button) if it is outside the maintenance window (check
the details of the local Reaction Management App log system entry).
For database
A MariaDB (10.4.4) Docker image contains the database schema of Reaction. The image can be pulled with the following commands:
docker pull reactionengine/mariadb:1.1The image can be started with the following command:
docker run -d reactionengine/mariadb:1.1The database name is reactionstore. The password of the mariaDB root user is root.
A database user exists to be used to connect to the database from the engine or from the management app: reaction / reactionengine
The superuser of the Reaction management app that can be only used to create users is: admin / reactionengine. It can be logged in on http://<container IP>/reaction-management/admin.